Scotch-Irish vs Immigrants from England 11th Grade
COMPARE
Scotch-Irish
Immigrants from England
11th Grade
11th Grade Comparison
Scotch-Irish
Immigrants from England
93.9%
11TH GRADE
99.8/ 100
METRIC RATING
69th/ 347
METRIC RANK
93.8%
11TH GRADE
99.7/ 100
METRIC RATING
70th/ 347
METRIC RANK
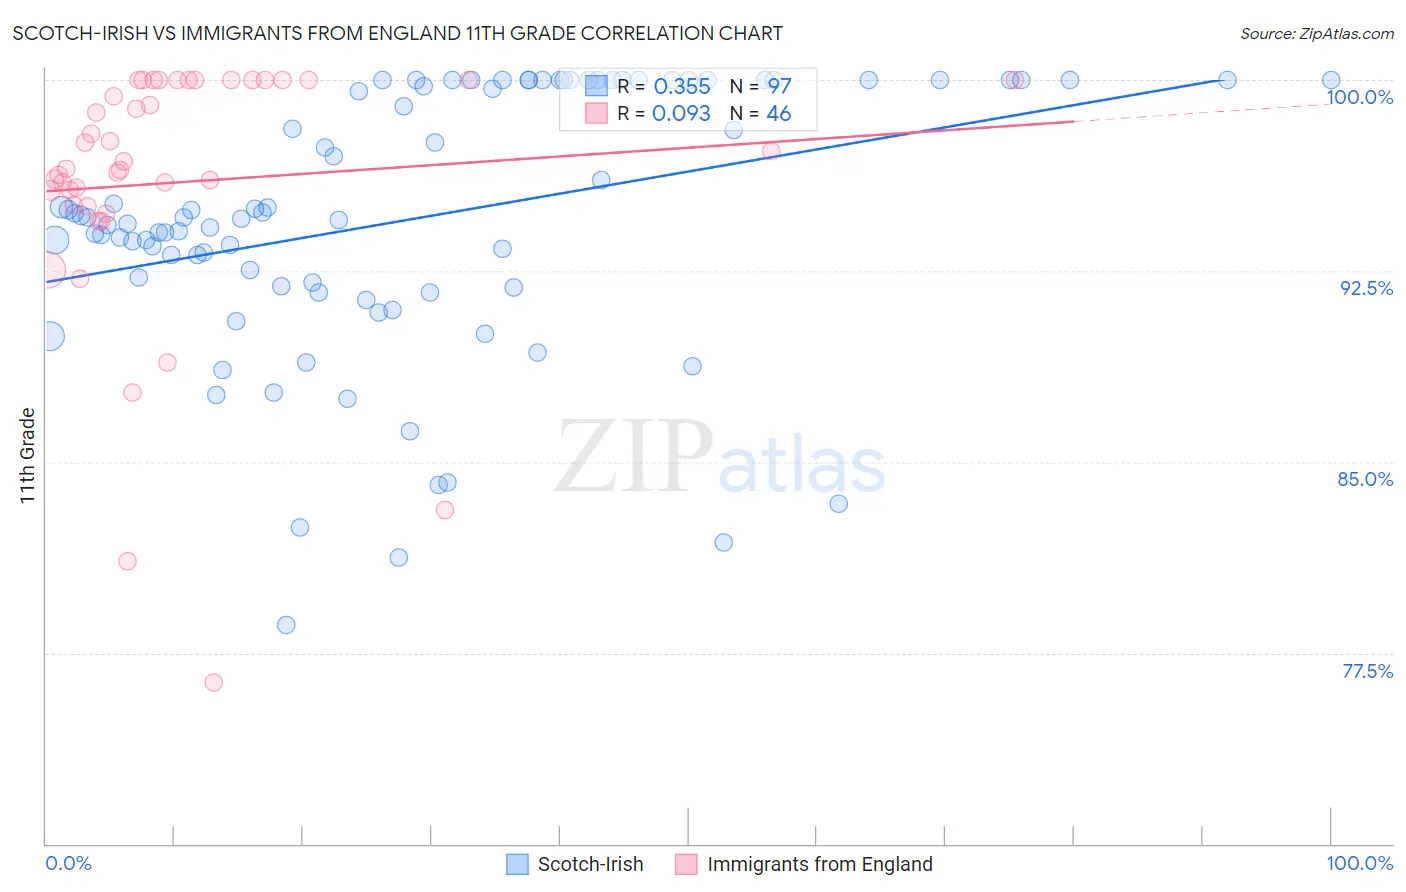
Scotch-Irish vs Immigrants from England 11th Grade Correlation Chart
The statistical analysis conducted on geographies consisting of 548,779,872 people shows a mild positive correlation between the proportion of Scotch-Irish and percentage of population with at least 11th grade education in the United States with a correlation coefficient (R) of 0.355 and weighted average of 93.9%. Similarly, the statistical analysis conducted on geographies consisting of 391,897,612 people shows a slight positive correlation between the proportion of Immigrants from England and percentage of population with at least 11th grade education in the United States with a correlation coefficient (R) of 0.093 and weighted average of 93.8%, a difference of 0.060%.
11th Grade Correlation Summary
| Measurement | Scotch-Irish | Immigrants from England |
| Minimum | 78.6% | 76.3% |
| Maximum | 100.0% | 100.0% |
| Range | 21.4% | 23.7% |
| Mean | 94.5% | 96.0% |
| Median | 94.6% | 96.7% |
| Interquartile 25% (IQ1) | 91.9% | 95.1% |
| Interquartile 75% (IQ3) | 100.0% | 100.0% |
| Interquartile Range (IQR) | 8.1% | 4.9% |
| Standard Deviation (Sample) | 5.2% | 5.2% |
| Standard Deviation (Population) | 5.1% | 5.1% |
Demographics Similar to Scotch-Irish and Immigrants from England by 11th Grade
In terms of 11th grade, the demographic groups most similar to Scotch-Irish are Zimbabwean (93.9%, a difference of 0.0%), Alaskan Athabascan (93.9%, a difference of 0.020%), Immigrants from Netherlands (93.9%, a difference of 0.020%), Immigrants from Sweden (93.9%, a difference of 0.040%), and Native Hawaiian (93.9%, a difference of 0.040%). Similarly, the demographic groups most similar to Immigrants from England are Immigrants from South Africa (93.8%, a difference of 0.010%), Immigrants from Japan (93.8%, a difference of 0.040%), Zimbabwean (93.9%, a difference of 0.060%), Romanian (93.8%, a difference of 0.060%), and Immigrants from Czechoslovakia (93.8%, a difference of 0.060%).
| Demographics | Rating | Rank | 11th Grade |
| Bhutanese | 99.8 /100 | #59 | Exceptional 94.0% |
| Okinawans | 99.8 /100 | #60 | Exceptional 94.0% |
| Immigrants | Belgium | 99.8 /100 | #61 | Exceptional 94.0% |
| Austrians | 99.8 /100 | #62 | Exceptional 94.0% |
| Ukrainians | 99.8 /100 | #63 | Exceptional 94.0% |
| Immigrants | Sweden | 99.8 /100 | #64 | Exceptional 93.9% |
| Native Hawaiians | 99.8 /100 | #65 | Exceptional 93.9% |
| Alaskan Athabascans | 99.8 /100 | #66 | Exceptional 93.9% |
| Immigrants | Netherlands | 99.8 /100 | #67 | Exceptional 93.9% |
| Zimbabweans | 99.8 /100 | #68 | Exceptional 93.9% |
| Scotch-Irish | 99.8 /100 | #69 | Exceptional 93.9% |
| Immigrants | England | 99.7 /100 | #70 | Exceptional 93.8% |
| Immigrants | South Africa | 99.7 /100 | #71 | Exceptional 93.8% |
| Immigrants | Japan | 99.7 /100 | #72 | Exceptional 93.8% |
| Romanians | 99.6 /100 | #73 | Exceptional 93.8% |
| Immigrants | Czechoslovakia | 99.6 /100 | #74 | Exceptional 93.8% |
| Immigrants | Latvia | 99.6 /100 | #75 | Exceptional 93.8% |
| Celtics | 99.5 /100 | #76 | Exceptional 93.7% |
| Aleuts | 99.5 /100 | #77 | Exceptional 93.7% |
| Soviet Union | 99.5 /100 | #78 | Exceptional 93.7% |
| Immigrants | Denmark | 99.5 /100 | #79 | Exceptional 93.7% |