Somali vs Immigrants from Ghana 11th Grade
COMPARE
Somali
Immigrants from Ghana
11th Grade
11th Grade Comparison
Somalis
Immigrants from Ghana
92.1%
11TH GRADE
11.6/ 100
METRIC RATING
216th/ 347
METRIC RANK
91.2%
11TH GRADE
0.3/ 100
METRIC RATING
263rd/ 347
METRIC RANK
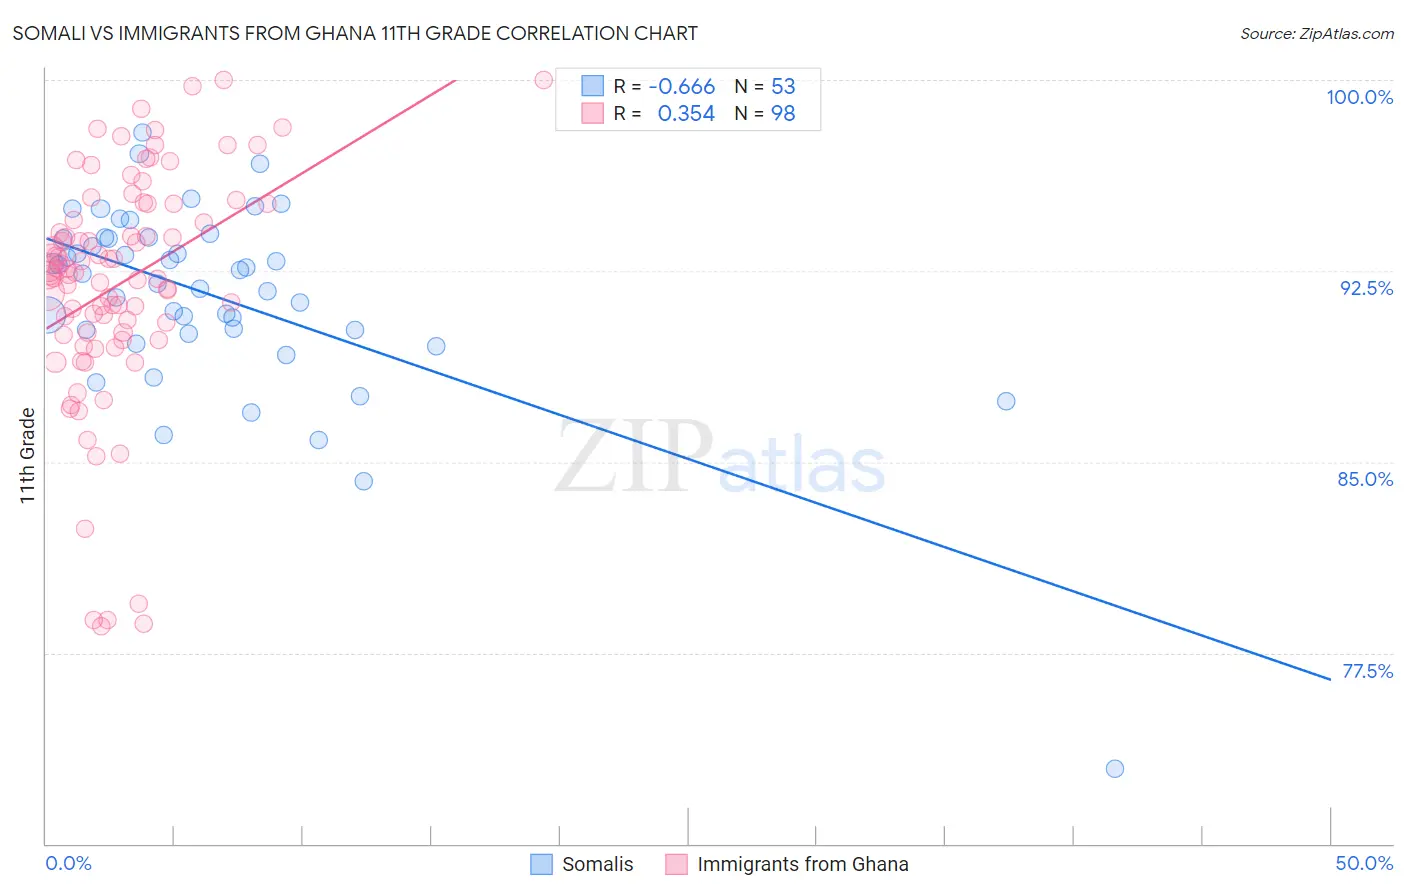
Somali vs Immigrants from Ghana 11th Grade Correlation Chart
The statistical analysis conducted on geographies consisting of 99,330,527 people shows a significant negative correlation between the proportion of Somalis and percentage of population with at least 11th grade education in the United States with a correlation coefficient (R) of -0.666 and weighted average of 92.1%. Similarly, the statistical analysis conducted on geographies consisting of 199,951,730 people shows a mild positive correlation between the proportion of Immigrants from Ghana and percentage of population with at least 11th grade education in the United States with a correlation coefficient (R) of 0.354 and weighted average of 91.2%, a difference of 0.92%.
11th Grade Correlation Summary
| Measurement | Somali | Immigrants from Ghana |
| Minimum | 72.9% | 78.5% |
| Maximum | 98.0% | 100.0% |
| Range | 25.0% | 21.5% |
| Mean | 91.5% | 92.0% |
| Median | 92.4% | 92.4% |
| Interquartile 25% (IQ1) | 90.1% | 90.1% |
| Interquartile 75% (IQ3) | 93.8% | 95.1% |
| Interquartile Range (IQR) | 3.7% | 5.0% |
| Standard Deviation (Sample) | 3.9% | 4.6% |
| Standard Deviation (Population) | 3.9% | 4.6% |
Similar Demographics by 11th Grade
Demographics Similar to Somalis by 11th Grade
In terms of 11th grade, the demographic groups most similar to Somalis are Immigrants from Sierra Leone (92.0%, a difference of 0.010%), Immigrants from Southern Europe (92.1%, a difference of 0.020%), Afghan (92.1%, a difference of 0.030%), Blackfeet (92.0%, a difference of 0.040%), and Portuguese (92.0%, a difference of 0.040%).
| Demographics | Rating | Rank | 11th Grade |
| Tongans | 19.8 /100 | #209 | Poor 92.2% |
| Ethiopians | 18.8 /100 | #210 | Poor 92.2% |
| Immigrants | Micronesia | 17.7 /100 | #211 | Poor 92.2% |
| Koreans | 14.4 /100 | #212 | Poor 92.1% |
| Immigrants | Ethiopia | 13.9 /100 | #213 | Poor 92.1% |
| Afghans | 12.8 /100 | #214 | Poor 92.1% |
| Immigrants | Southern Europe | 12.5 /100 | #215 | Poor 92.1% |
| Somalis | 11.6 /100 | #216 | Poor 92.1% |
| Immigrants | Sierra Leone | 11.1 /100 | #217 | Poor 92.0% |
| Blackfeet | 10.1 /100 | #218 | Poor 92.0% |
| Portuguese | 10.0 /100 | #219 | Tragic 92.0% |
| South American Indians | 7.6 /100 | #220 | Tragic 92.0% |
| Immigrants | Liberia | 7.0 /100 | #221 | Tragic 91.9% |
| Immigrants | Africa | 6.5 /100 | #222 | Tragic 91.9% |
| Immigrants | Bahamas | 6.5 /100 | #223 | Tragic 91.9% |
Demographics Similar to Immigrants from Ghana by 11th Grade
In terms of 11th grade, the demographic groups most similar to Immigrants from Ghana are Yup'ik (91.2%, a difference of 0.020%), Pueblo (91.2%, a difference of 0.020%), Immigrants from Western Africa (91.2%, a difference of 0.050%), Immigrants from Jamaica (91.2%, a difference of 0.050%), and Immigrants from Uruguay (91.3%, a difference of 0.13%).
| Demographics | Rating | Rank | 11th Grade |
| Immigrants | Senegal | 0.7 /100 | #256 | Tragic 91.4% |
| Cajuns | 0.7 /100 | #257 | Tragic 91.4% |
| Immigrants | Colombia | 0.6 /100 | #258 | Tragic 91.4% |
| Jamaicans | 0.6 /100 | #259 | Tragic 91.4% |
| Spanish Americans | 0.6 /100 | #260 | Tragic 91.4% |
| Taiwanese | 0.6 /100 | #261 | Tragic 91.3% |
| Immigrants | Uruguay | 0.5 /100 | #262 | Tragic 91.3% |
| Immigrants | Ghana | 0.3 /100 | #263 | Tragic 91.2% |
| Yup'ik | 0.3 /100 | #264 | Tragic 91.2% |
| Pueblo | 0.3 /100 | #265 | Tragic 91.2% |
| Immigrants | Western Africa | 0.3 /100 | #266 | Tragic 91.2% |
| Immigrants | Jamaica | 0.3 /100 | #267 | Tragic 91.2% |
| U.S. Virgin Islanders | 0.2 /100 | #268 | Tragic 91.1% |
| Ute | 0.2 /100 | #269 | Tragic 91.1% |
| Trinidadians and Tobagonians | 0.2 /100 | #270 | Tragic 91.1% |