Scotch-Irish vs Dominican 11th Grade
COMPARE
Scotch-Irish
Dominican
11th Grade
11th Grade Comparison
Scotch-Irish
Dominicans
93.9%
11TH GRADE
99.8/ 100
METRIC RATING
69th/ 347
METRIC RANK
87.7%
11TH GRADE
0.0/ 100
METRIC RATING
326th/ 347
METRIC RANK
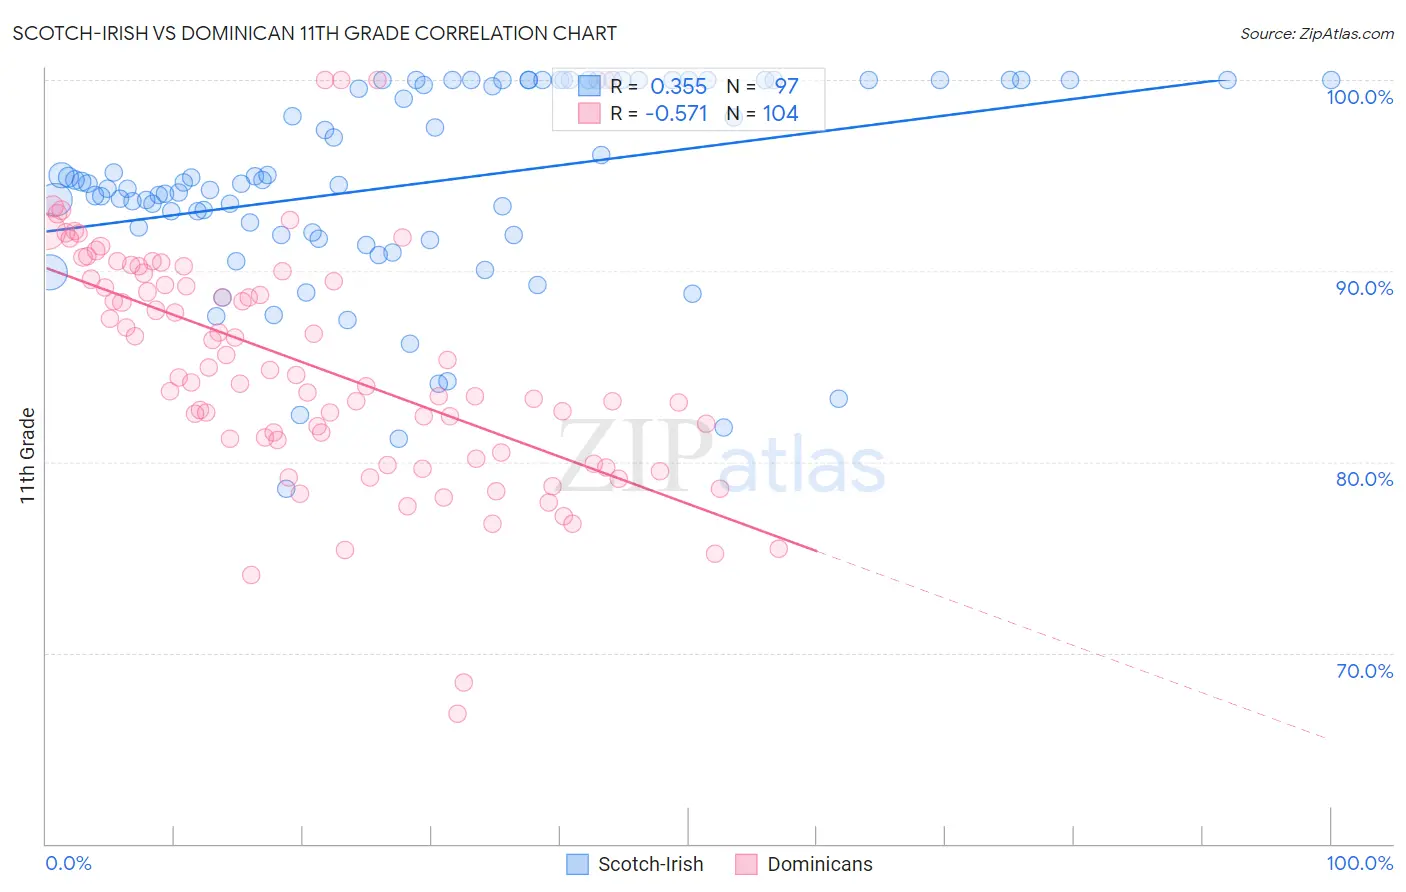
Scotch-Irish vs Dominican 11th Grade Correlation Chart
The statistical analysis conducted on geographies consisting of 548,779,872 people shows a mild positive correlation between the proportion of Scotch-Irish and percentage of population with at least 11th grade education in the United States with a correlation coefficient (R) of 0.355 and weighted average of 93.9%. Similarly, the statistical analysis conducted on geographies consisting of 355,142,452 people shows a substantial negative correlation between the proportion of Dominicans and percentage of population with at least 11th grade education in the United States with a correlation coefficient (R) of -0.571 and weighted average of 87.7%, a difference of 7.1%.
11th Grade Correlation Summary
| Measurement | Scotch-Irish | Dominican |
| Minimum | 78.6% | 66.8% |
| Maximum | 100.0% | 100.0% |
| Range | 21.4% | 33.2% |
| Mean | 94.5% | 85.1% |
| Median | 94.6% | 84.5% |
| Interquartile 25% (IQ1) | 91.9% | 80.8% |
| Interquartile 75% (IQ3) | 100.0% | 89.7% |
| Interquartile Range (IQR) | 8.1% | 8.9% |
| Standard Deviation (Sample) | 5.2% | 6.2% |
| Standard Deviation (Population) | 5.1% | 6.2% |
Similar Demographics by 11th Grade
Demographics Similar to Scotch-Irish by 11th Grade
In terms of 11th grade, the demographic groups most similar to Scotch-Irish are Zimbabwean (93.9%, a difference of 0.0%), Alaskan Athabascan (93.9%, a difference of 0.020%), Immigrants from Netherlands (93.9%, a difference of 0.020%), Immigrants from Sweden (93.9%, a difference of 0.040%), and Native Hawaiian (93.9%, a difference of 0.040%).
| Demographics | Rating | Rank | 11th Grade |
| Austrians | 99.8 /100 | #62 | Exceptional 94.0% |
| Ukrainians | 99.8 /100 | #63 | Exceptional 94.0% |
| Immigrants | Sweden | 99.8 /100 | #64 | Exceptional 93.9% |
| Native Hawaiians | 99.8 /100 | #65 | Exceptional 93.9% |
| Alaskan Athabascans | 99.8 /100 | #66 | Exceptional 93.9% |
| Immigrants | Netherlands | 99.8 /100 | #67 | Exceptional 93.9% |
| Zimbabweans | 99.8 /100 | #68 | Exceptional 93.9% |
| Scotch-Irish | 99.8 /100 | #69 | Exceptional 93.9% |
| Immigrants | England | 99.7 /100 | #70 | Exceptional 93.8% |
| Immigrants | South Africa | 99.7 /100 | #71 | Exceptional 93.8% |
| Immigrants | Japan | 99.7 /100 | #72 | Exceptional 93.8% |
| Romanians | 99.6 /100 | #73 | Exceptional 93.8% |
| Immigrants | Czechoslovakia | 99.6 /100 | #74 | Exceptional 93.8% |
| Immigrants | Latvia | 99.6 /100 | #75 | Exceptional 93.8% |
| Celtics | 99.5 /100 | #76 | Exceptional 93.7% |
Demographics Similar to Dominicans by 11th Grade
In terms of 11th grade, the demographic groups most similar to Dominicans are Immigrants from Cabo Verde (87.6%, a difference of 0.020%), Tohono O'odham (87.6%, a difference of 0.080%), Mexican American Indian (87.5%, a difference of 0.15%), Honduran (87.4%, a difference of 0.34%), and Hispanic or Latino (87.3%, a difference of 0.40%).
| Demographics | Rating | Rank | 11th Grade |
| Belizeans | 0.0 /100 | #319 | Tragic 88.8% |
| Immigrants | Armenia | 0.0 /100 | #320 | Tragic 88.8% |
| Immigrants | Belize | 0.0 /100 | #321 | Tragic 88.7% |
| Puerto Ricans | 0.0 /100 | #322 | Tragic 88.4% |
| Pima | 0.0 /100 | #323 | Tragic 88.3% |
| Central American Indians | 0.0 /100 | #324 | Tragic 88.2% |
| Immigrants | Nicaragua | 0.0 /100 | #325 | Tragic 88.1% |
| Dominicans | 0.0 /100 | #326 | Tragic 87.7% |
| Immigrants | Cabo Verde | 0.0 /100 | #327 | Tragic 87.6% |
| Tohono O'odham | 0.0 /100 | #328 | Tragic 87.6% |
| Mexican American Indians | 0.0 /100 | #329 | Tragic 87.5% |
| Hondurans | 0.0 /100 | #330 | Tragic 87.4% |
| Hispanics or Latinos | 0.0 /100 | #331 | Tragic 87.3% |
| Immigrants | Azores | 0.0 /100 | #332 | Tragic 87.2% |
| Immigrants | Yemen | 0.0 /100 | #333 | Tragic 87.1% |