Scotch-Irish vs Immigrants from Austria 11th Grade
COMPARE
Scotch-Irish
Immigrants from Austria
11th Grade
11th Grade Comparison
Scotch-Irish
Immigrants from Austria
93.9%
11TH GRADE
99.8/ 100
METRIC RATING
69th/ 347
METRIC RANK
94.1%
11TH GRADE
99.9/ 100
METRIC RATING
42nd/ 347
METRIC RANK
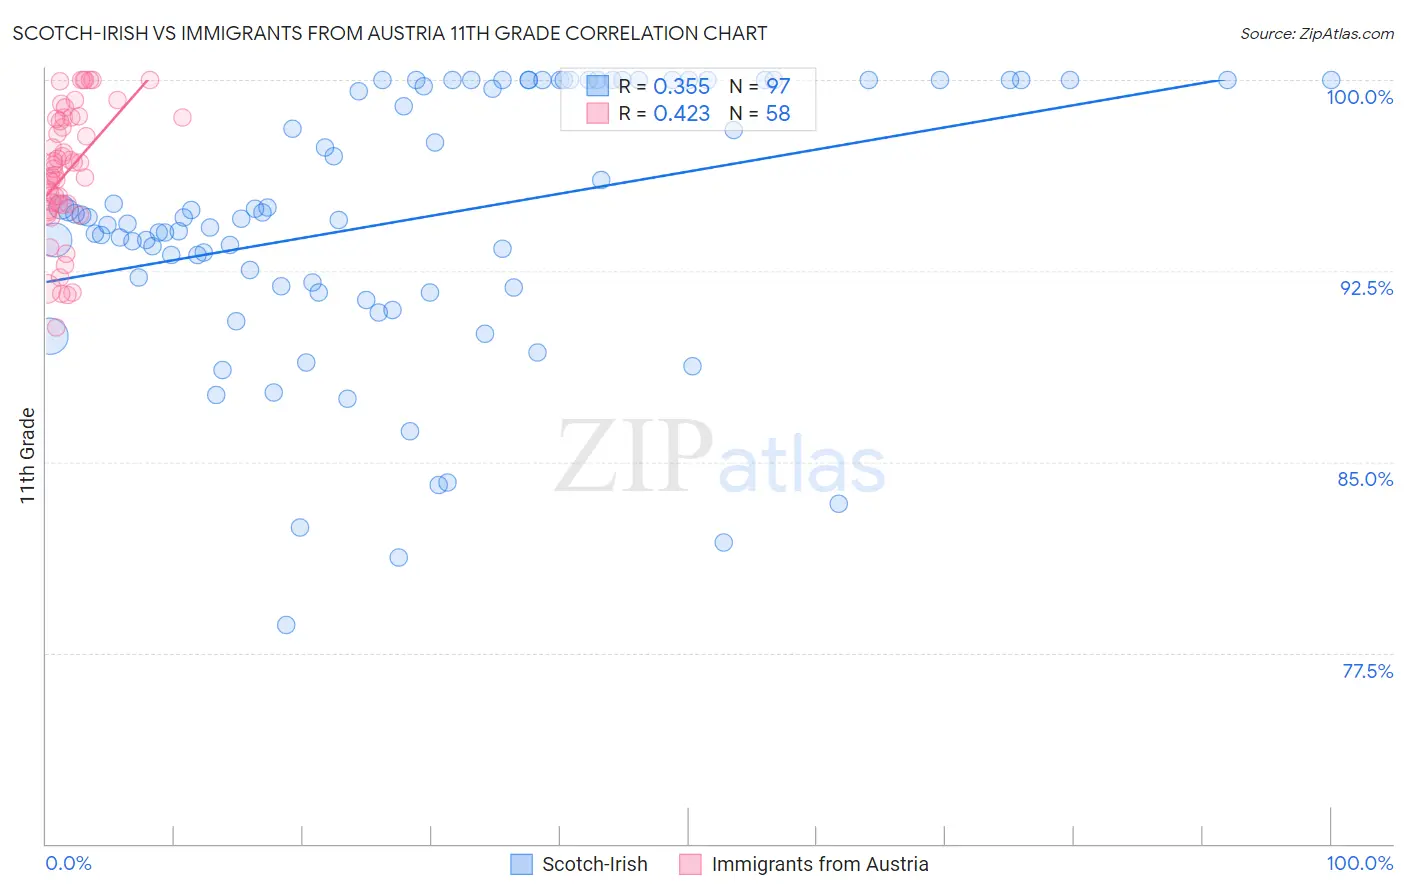
Scotch-Irish vs Immigrants from Austria 11th Grade Correlation Chart
The statistical analysis conducted on geographies consisting of 548,779,872 people shows a mild positive correlation between the proportion of Scotch-Irish and percentage of population with at least 11th grade education in the United States with a correlation coefficient (R) of 0.355 and weighted average of 93.9%. Similarly, the statistical analysis conducted on geographies consisting of 167,973,618 people shows a moderate positive correlation between the proportion of Immigrants from Austria and percentage of population with at least 11th grade education in the United States with a correlation coefficient (R) of 0.423 and weighted average of 94.1%, a difference of 0.23%.
11th Grade Correlation Summary
| Measurement | Scotch-Irish | Immigrants from Austria |
| Minimum | 78.6% | 90.3% |
| Maximum | 100.0% | 100.0% |
| Range | 21.4% | 9.7% |
| Mean | 94.5% | 96.4% |
| Median | 94.6% | 96.6% |
| Interquartile 25% (IQ1) | 91.9% | 95.1% |
| Interquartile 75% (IQ3) | 100.0% | 98.5% |
| Interquartile Range (IQR) | 8.1% | 3.5% |
| Standard Deviation (Sample) | 5.2% | 2.5% |
| Standard Deviation (Population) | 5.1% | 2.5% |
Similar Demographics by 11th Grade
Demographics Similar to Scotch-Irish by 11th Grade
In terms of 11th grade, the demographic groups most similar to Scotch-Irish are Zimbabwean (93.9%, a difference of 0.0%), Alaskan Athabascan (93.9%, a difference of 0.020%), Immigrants from Netherlands (93.9%, a difference of 0.020%), Immigrants from Sweden (93.9%, a difference of 0.040%), and Native Hawaiian (93.9%, a difference of 0.040%).
| Demographics | Rating | Rank | 11th Grade |
| Austrians | 99.8 /100 | #62 | Exceptional 94.0% |
| Ukrainians | 99.8 /100 | #63 | Exceptional 94.0% |
| Immigrants | Sweden | 99.8 /100 | #64 | Exceptional 93.9% |
| Native Hawaiians | 99.8 /100 | #65 | Exceptional 93.9% |
| Alaskan Athabascans | 99.8 /100 | #66 | Exceptional 93.9% |
| Immigrants | Netherlands | 99.8 /100 | #67 | Exceptional 93.9% |
| Zimbabweans | 99.8 /100 | #68 | Exceptional 93.9% |
| Scotch-Irish | 99.8 /100 | #69 | Exceptional 93.9% |
| Immigrants | England | 99.7 /100 | #70 | Exceptional 93.8% |
| Immigrants | South Africa | 99.7 /100 | #71 | Exceptional 93.8% |
| Immigrants | Japan | 99.7 /100 | #72 | Exceptional 93.8% |
| Romanians | 99.6 /100 | #73 | Exceptional 93.8% |
| Immigrants | Czechoslovakia | 99.6 /100 | #74 | Exceptional 93.8% |
| Immigrants | Latvia | 99.6 /100 | #75 | Exceptional 93.8% |
| Celtics | 99.5 /100 | #76 | Exceptional 93.7% |
Demographics Similar to Immigrants from Austria by 11th Grade
In terms of 11th grade, the demographic groups most similar to Immigrants from Austria are Cypriot (94.1%, a difference of 0.010%), Greek (94.1%, a difference of 0.010%), Immigrants from Lithuania (94.1%, a difference of 0.020%), Thai (94.1%, a difference of 0.020%), and Immigrants from Ireland (94.1%, a difference of 0.020%).
| Demographics | Rating | Rank | 11th Grade |
| Immigrants | Singapore | 99.9 /100 | #35 | Exceptional 94.2% |
| Immigrants | Northern Europe | 99.9 /100 | #36 | Exceptional 94.2% |
| Northern Europeans | 99.9 /100 | #37 | Exceptional 94.2% |
| Hungarians | 99.9 /100 | #38 | Exceptional 94.2% |
| Immigrants | Lithuania | 99.9 /100 | #39 | Exceptional 94.1% |
| Thais | 99.9 /100 | #40 | Exceptional 94.1% |
| Cypriots | 99.9 /100 | #41 | Exceptional 94.1% |
| Immigrants | Austria | 99.9 /100 | #42 | Exceptional 94.1% |
| Greeks | 99.9 /100 | #43 | Exceptional 94.1% |
| Immigrants | Ireland | 99.9 /100 | #44 | Exceptional 94.1% |
| Australians | 99.9 /100 | #45 | Exceptional 94.1% |
| Serbians | 99.9 /100 | #46 | Exceptional 94.1% |
| Filipinos | 99.9 /100 | #47 | Exceptional 94.1% |
| Macedonians | 99.9 /100 | #48 | Exceptional 94.1% |
| Slavs | 99.9 /100 | #49 | Exceptional 94.1% |