Trinidadian and Tobagonian vs Immigrants from Ghana 11th Grade
COMPARE
Trinidadian and Tobagonian
Immigrants from Ghana
11th Grade
11th Grade Comparison
Trinidadians and Tobagonians
Immigrants from Ghana
91.1%
11TH GRADE
0.2/ 100
METRIC RATING
270th/ 347
METRIC RANK
91.2%
11TH GRADE
0.3/ 100
METRIC RATING
263rd/ 347
METRIC RANK
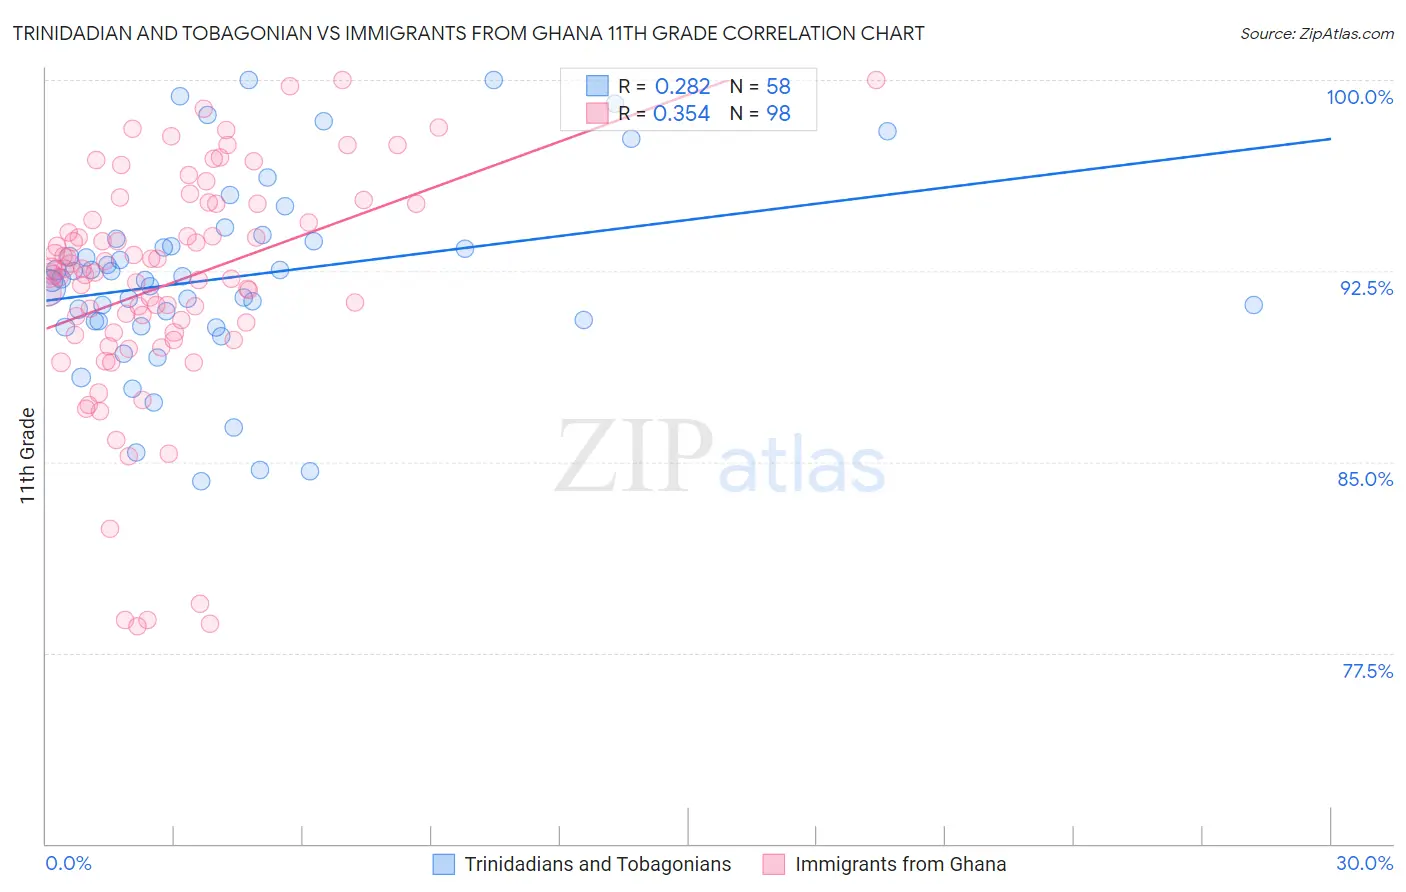
Trinidadian and Tobagonian vs Immigrants from Ghana 11th Grade Correlation Chart
The statistical analysis conducted on geographies consisting of 219,881,170 people shows a weak positive correlation between the proportion of Trinidadians and Tobagonians and percentage of population with at least 11th grade education in the United States with a correlation coefficient (R) of 0.282 and weighted average of 91.1%. Similarly, the statistical analysis conducted on geographies consisting of 199,951,730 people shows a mild positive correlation between the proportion of Immigrants from Ghana and percentage of population with at least 11th grade education in the United States with a correlation coefficient (R) of 0.354 and weighted average of 91.2%, a difference of 0.18%.
11th Grade Correlation Summary
| Measurement | Trinidadian and Tobagonian | Immigrants from Ghana |
| Minimum | 84.2% | 78.5% |
| Maximum | 100.0% | 100.0% |
| Range | 15.8% | 21.5% |
| Mean | 92.2% | 92.0% |
| Median | 92.2% | 92.4% |
| Interquartile 25% (IQ1) | 90.5% | 90.1% |
| Interquartile 75% (IQ3) | 93.7% | 95.1% |
| Interquartile Range (IQR) | 3.2% | 5.0% |
| Standard Deviation (Sample) | 3.7% | 4.6% |
| Standard Deviation (Population) | 3.7% | 4.6% |
Demographics Similar to Trinidadians and Tobagonians and Immigrants from Ghana by 11th Grade
In terms of 11th grade, the demographic groups most similar to Trinidadians and Tobagonians are Ute (91.1%, a difference of 0.030%), Immigrants from Peru (91.0%, a difference of 0.030%), West Indian (91.0%, a difference of 0.040%), U.S. Virgin Islander (91.1%, a difference of 0.060%), and Paiute (91.0%, a difference of 0.080%). Similarly, the demographic groups most similar to Immigrants from Ghana are Yup'ik (91.2%, a difference of 0.020%), Pueblo (91.2%, a difference of 0.020%), Immigrants from Western Africa (91.2%, a difference of 0.050%), Immigrants from Jamaica (91.2%, a difference of 0.050%), and Immigrants from Uruguay (91.3%, a difference of 0.13%).
| Demographics | Rating | Rank | 11th Grade |
| Immigrants | Senegal | 0.7 /100 | #256 | Tragic 91.4% |
| Cajuns | 0.7 /100 | #257 | Tragic 91.4% |
| Immigrants | Colombia | 0.6 /100 | #258 | Tragic 91.4% |
| Jamaicans | 0.6 /100 | #259 | Tragic 91.4% |
| Spanish Americans | 0.6 /100 | #260 | Tragic 91.4% |
| Taiwanese | 0.6 /100 | #261 | Tragic 91.3% |
| Immigrants | Uruguay | 0.5 /100 | #262 | Tragic 91.3% |
| Immigrants | Ghana | 0.3 /100 | #263 | Tragic 91.2% |
| Yup'ik | 0.3 /100 | #264 | Tragic 91.2% |
| Pueblo | 0.3 /100 | #265 | Tragic 91.2% |
| Immigrants | Western Africa | 0.3 /100 | #266 | Tragic 91.2% |
| Immigrants | Jamaica | 0.3 /100 | #267 | Tragic 91.2% |
| U.S. Virgin Islanders | 0.2 /100 | #268 | Tragic 91.1% |
| Ute | 0.2 /100 | #269 | Tragic 91.1% |
| Trinidadians and Tobagonians | 0.2 /100 | #270 | Tragic 91.1% |
| Immigrants | Peru | 0.1 /100 | #271 | Tragic 91.0% |
| West Indians | 0.1 /100 | #272 | Tragic 91.0% |
| Paiute | 0.1 /100 | #273 | Tragic 91.0% |
| Immigrants | Trinidad and Tobago | 0.1 /100 | #274 | Tragic 90.9% |
| Immigrants | South Eastern Asia | 0.1 /100 | #275 | Tragic 90.9% |
| Bangladeshis | 0.1 /100 | #276 | Tragic 90.9% |