Scotch-Irish vs Nepalese 11th Grade
COMPARE
Scotch-Irish
Nepalese
11th Grade
11th Grade Comparison
Scotch-Irish
Nepalese
93.9%
11TH GRADE
99.8/ 100
METRIC RATING
69th/ 347
METRIC RANK
89.5%
11TH GRADE
0.0/ 100
METRIC RATING
308th/ 347
METRIC RANK
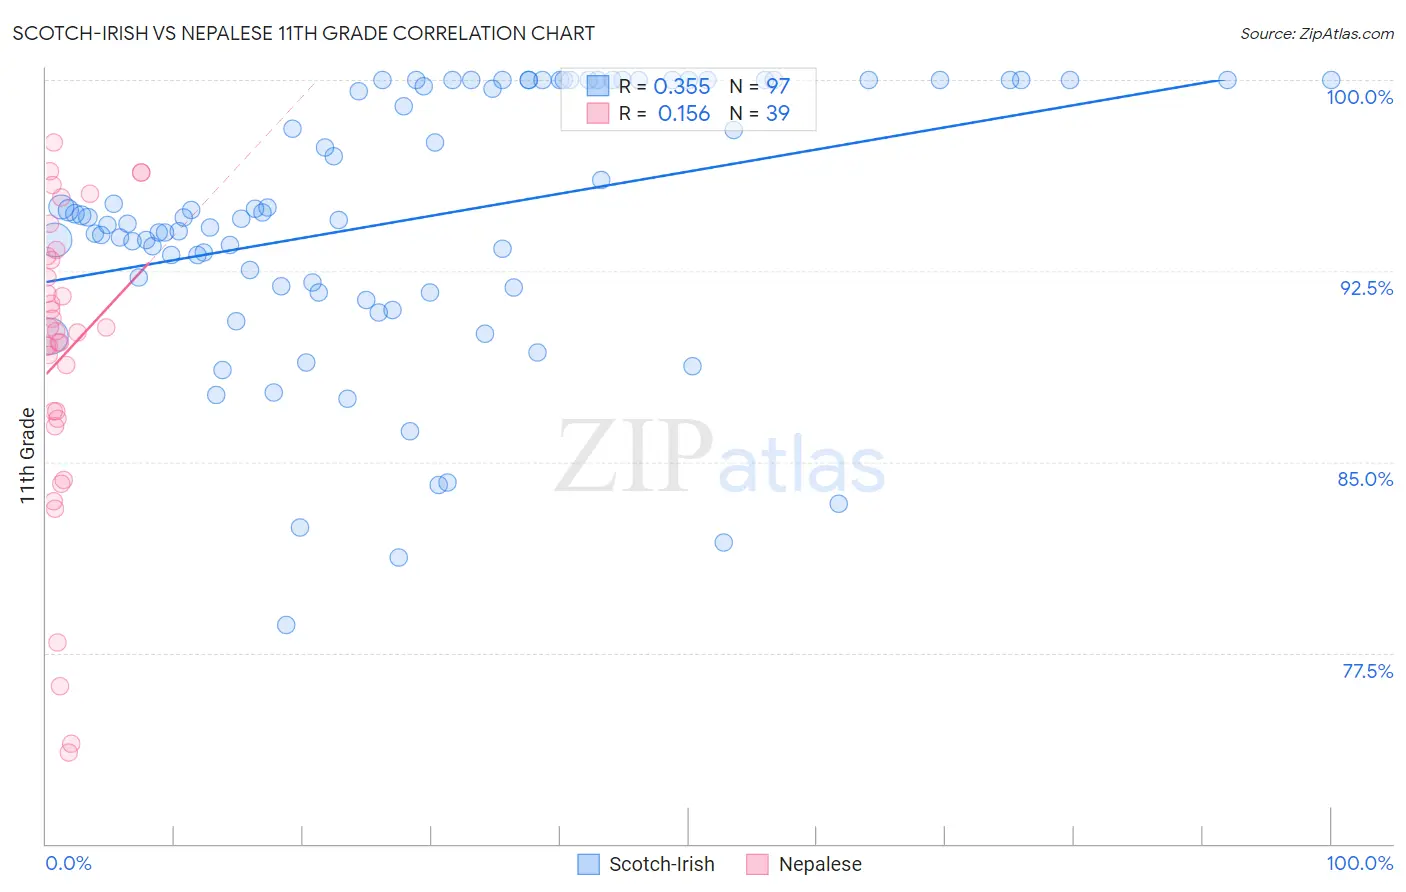
Scotch-Irish vs Nepalese 11th Grade Correlation Chart
The statistical analysis conducted on geographies consisting of 548,779,872 people shows a mild positive correlation between the proportion of Scotch-Irish and percentage of population with at least 11th grade education in the United States with a correlation coefficient (R) of 0.355 and weighted average of 93.9%. Similarly, the statistical analysis conducted on geographies consisting of 24,519,269 people shows a poor positive correlation between the proportion of Nepalese and percentage of population with at least 11th grade education in the United States with a correlation coefficient (R) of 0.156 and weighted average of 89.5%, a difference of 4.9%.
11th Grade Correlation Summary
| Measurement | Scotch-Irish | Nepalese |
| Minimum | 78.6% | 73.6% |
| Maximum | 100.0% | 97.6% |
| Range | 21.4% | 24.0% |
| Mean | 94.5% | 89.1% |
| Median | 94.6% | 90.1% |
| Interquartile 25% (IQ1) | 91.9% | 86.7% |
| Interquartile 75% (IQ3) | 100.0% | 93.1% |
| Interquartile Range (IQR) | 8.1% | 6.4% |
| Standard Deviation (Sample) | 5.2% | 6.0% |
| Standard Deviation (Population) | 5.1% | 5.9% |
Similar Demographics by 11th Grade
Demographics Similar to Scotch-Irish by 11th Grade
In terms of 11th grade, the demographic groups most similar to Scotch-Irish are Zimbabwean (93.9%, a difference of 0.0%), Alaskan Athabascan (93.9%, a difference of 0.020%), Immigrants from Netherlands (93.9%, a difference of 0.020%), Immigrants from Sweden (93.9%, a difference of 0.040%), and Native Hawaiian (93.9%, a difference of 0.040%).
| Demographics | Rating | Rank | 11th Grade |
| Austrians | 99.8 /100 | #62 | Exceptional 94.0% |
| Ukrainians | 99.8 /100 | #63 | Exceptional 94.0% |
| Immigrants | Sweden | 99.8 /100 | #64 | Exceptional 93.9% |
| Native Hawaiians | 99.8 /100 | #65 | Exceptional 93.9% |
| Alaskan Athabascans | 99.8 /100 | #66 | Exceptional 93.9% |
| Immigrants | Netherlands | 99.8 /100 | #67 | Exceptional 93.9% |
| Zimbabweans | 99.8 /100 | #68 | Exceptional 93.9% |
| Scotch-Irish | 99.8 /100 | #69 | Exceptional 93.9% |
| Immigrants | England | 99.7 /100 | #70 | Exceptional 93.8% |
| Immigrants | South Africa | 99.7 /100 | #71 | Exceptional 93.8% |
| Immigrants | Japan | 99.7 /100 | #72 | Exceptional 93.8% |
| Romanians | 99.6 /100 | #73 | Exceptional 93.8% |
| Immigrants | Czechoslovakia | 99.6 /100 | #74 | Exceptional 93.8% |
| Immigrants | Latvia | 99.6 /100 | #75 | Exceptional 93.8% |
| Celtics | 99.5 /100 | #76 | Exceptional 93.7% |
Demographics Similar to Nepalese by 11th Grade
In terms of 11th grade, the demographic groups most similar to Nepalese are Immigrants from Dominica (89.5%, a difference of 0.020%), Immigrants from Bangladesh (89.5%, a difference of 0.020%), Yaqui (89.5%, a difference of 0.030%), Ecuadorian (89.6%, a difference of 0.070%), and Vietnamese (89.4%, a difference of 0.10%).
| Demographics | Rating | Rank | 11th Grade |
| Guyanese | 0.0 /100 | #301 | Tragic 89.9% |
| Immigrants | Guyana | 0.0 /100 | #302 | Tragic 89.7% |
| Immigrants | Immigrants | 0.0 /100 | #303 | Tragic 89.7% |
| Yuman | 0.0 /100 | #304 | Tragic 89.7% |
| Immigrants | Cambodia | 0.0 /100 | #305 | Tragic 89.6% |
| Ecuadorians | 0.0 /100 | #306 | Tragic 89.6% |
| Immigrants | Dominica | 0.0 /100 | #307 | Tragic 89.5% |
| Nepalese | 0.0 /100 | #308 | Tragic 89.5% |
| Immigrants | Bangladesh | 0.0 /100 | #309 | Tragic 89.5% |
| Yaqui | 0.0 /100 | #310 | Tragic 89.5% |
| Vietnamese | 0.0 /100 | #311 | Tragic 89.4% |
| Immigrants | Portugal | 0.0 /100 | #312 | Tragic 89.3% |
| Immigrants | Caribbean | 0.0 /100 | #313 | Tragic 89.1% |
| Cape Verdeans | 0.0 /100 | #314 | Tragic 89.1% |
| Immigrants | Ecuador | 0.0 /100 | #315 | Tragic 89.1% |