Scotch-Irish vs Immigrants from Congo 11th Grade
COMPARE
Scotch-Irish
Immigrants from Congo
11th Grade
11th Grade Comparison
Scotch-Irish
Immigrants from Congo
93.9%
11TH GRADE
99.8/ 100
METRIC RATING
69th/ 347
METRIC RANK
90.9%
11TH GRADE
0.1/ 100
METRIC RATING
277th/ 347
METRIC RANK
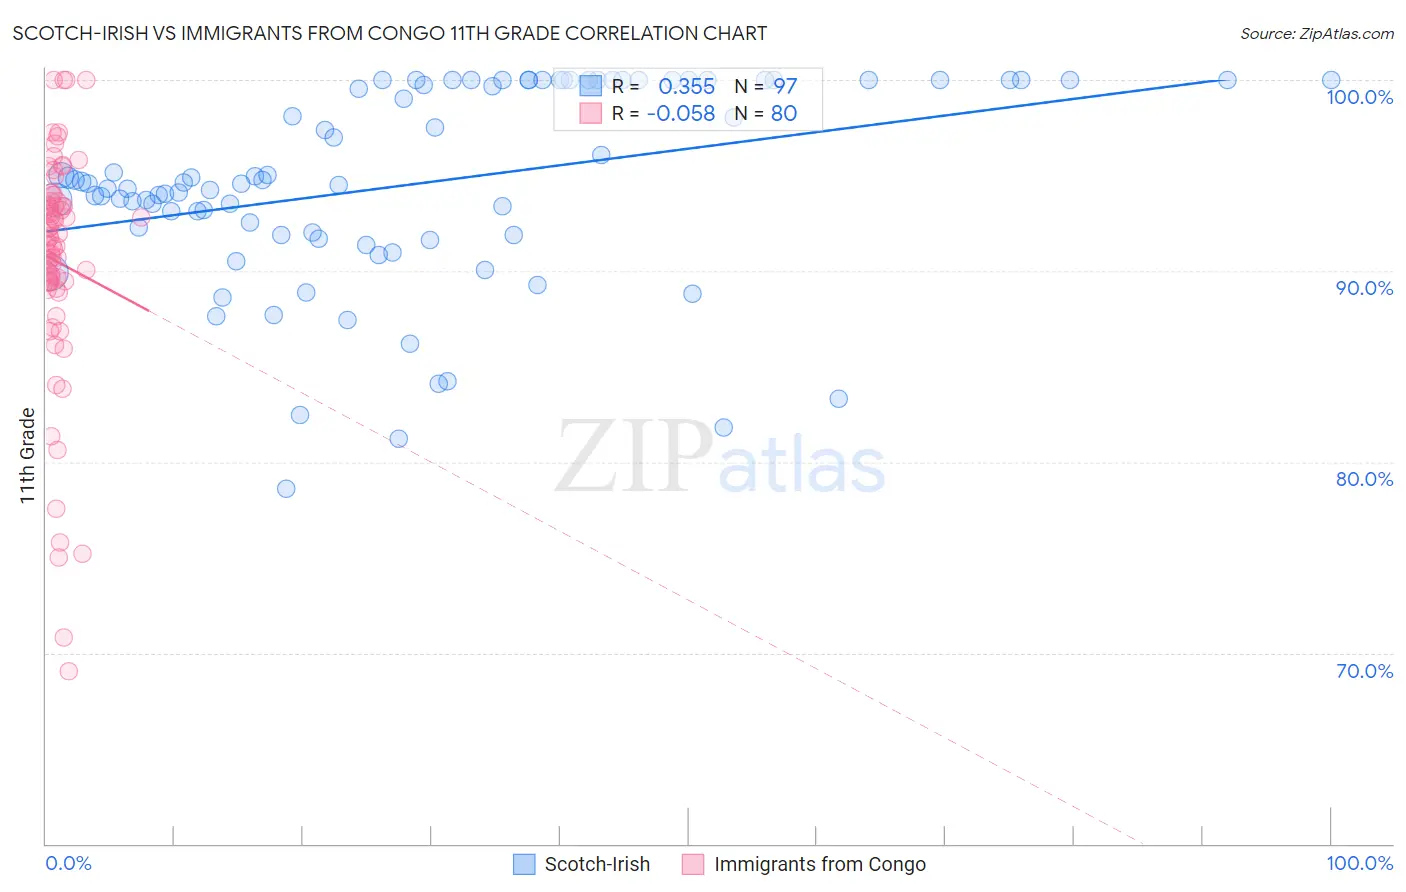
Scotch-Irish vs Immigrants from Congo 11th Grade Correlation Chart
The statistical analysis conducted on geographies consisting of 548,779,872 people shows a mild positive correlation between the proportion of Scotch-Irish and percentage of population with at least 11th grade education in the United States with a correlation coefficient (R) of 0.355 and weighted average of 93.9%. Similarly, the statistical analysis conducted on geographies consisting of 92,134,351 people shows a slight negative correlation between the proportion of Immigrants from Congo and percentage of population with at least 11th grade education in the United States with a correlation coefficient (R) of -0.058 and weighted average of 90.9%, a difference of 3.4%.
11th Grade Correlation Summary
| Measurement | Scotch-Irish | Immigrants from Congo |
| Minimum | 78.6% | 69.1% |
| Maximum | 100.0% | 100.0% |
| Range | 21.4% | 30.9% |
| Mean | 94.5% | 90.5% |
| Median | 94.6% | 91.6% |
| Interquartile 25% (IQ1) | 91.9% | 89.4% |
| Interquartile 75% (IQ3) | 100.0% | 93.5% |
| Interquartile Range (IQR) | 8.1% | 4.1% |
| Standard Deviation (Sample) | 5.2% | 6.1% |
| Standard Deviation (Population) | 5.1% | 6.1% |
Similar Demographics by 11th Grade
Demographics Similar to Scotch-Irish by 11th Grade
In terms of 11th grade, the demographic groups most similar to Scotch-Irish are Zimbabwean (93.9%, a difference of 0.0%), Alaskan Athabascan (93.9%, a difference of 0.020%), Immigrants from Netherlands (93.9%, a difference of 0.020%), Immigrants from Sweden (93.9%, a difference of 0.040%), and Native Hawaiian (93.9%, a difference of 0.040%).
| Demographics | Rating | Rank | 11th Grade |
| Austrians | 99.8 /100 | #62 | Exceptional 94.0% |
| Ukrainians | 99.8 /100 | #63 | Exceptional 94.0% |
| Immigrants | Sweden | 99.8 /100 | #64 | Exceptional 93.9% |
| Native Hawaiians | 99.8 /100 | #65 | Exceptional 93.9% |
| Alaskan Athabascans | 99.8 /100 | #66 | Exceptional 93.9% |
| Immigrants | Netherlands | 99.8 /100 | #67 | Exceptional 93.9% |
| Zimbabweans | 99.8 /100 | #68 | Exceptional 93.9% |
| Scotch-Irish | 99.8 /100 | #69 | Exceptional 93.9% |
| Immigrants | England | 99.7 /100 | #70 | Exceptional 93.8% |
| Immigrants | South Africa | 99.7 /100 | #71 | Exceptional 93.8% |
| Immigrants | Japan | 99.7 /100 | #72 | Exceptional 93.8% |
| Romanians | 99.6 /100 | #73 | Exceptional 93.8% |
| Immigrants | Czechoslovakia | 99.6 /100 | #74 | Exceptional 93.8% |
| Immigrants | Latvia | 99.6 /100 | #75 | Exceptional 93.8% |
| Celtics | 99.5 /100 | #76 | Exceptional 93.7% |
Demographics Similar to Immigrants from Congo by 11th Grade
In terms of 11th grade, the demographic groups most similar to Immigrants from Congo are Bangladeshi (90.9%, a difference of 0.020%), Malaysian (90.8%, a difference of 0.040%), Barbadian (90.8%, a difference of 0.080%), Immigrants from South Eastern Asia (90.9%, a difference of 0.090%), and Immigrants from Trinidad and Tobago (90.9%, a difference of 0.10%).
| Demographics | Rating | Rank | 11th Grade |
| Trinidadians and Tobagonians | 0.2 /100 | #270 | Tragic 91.1% |
| Immigrants | Peru | 0.1 /100 | #271 | Tragic 91.0% |
| West Indians | 0.1 /100 | #272 | Tragic 91.0% |
| Paiute | 0.1 /100 | #273 | Tragic 91.0% |
| Immigrants | Trinidad and Tobago | 0.1 /100 | #274 | Tragic 90.9% |
| Immigrants | South Eastern Asia | 0.1 /100 | #275 | Tragic 90.9% |
| Bangladeshis | 0.1 /100 | #276 | Tragic 90.9% |
| Immigrants | Congo | 0.1 /100 | #277 | Tragic 90.9% |
| Malaysians | 0.1 /100 | #278 | Tragic 90.8% |
| Barbadians | 0.0 /100 | #279 | Tragic 90.8% |
| Sri Lankans | 0.0 /100 | #280 | Tragic 90.7% |
| Dutch West Indians | 0.0 /100 | #281 | Tragic 90.7% |
| Immigrants | St. Vincent and the Grenadines | 0.0 /100 | #282 | Tragic 90.7% |
| Immigrants | Barbados | 0.0 /100 | #283 | Tragic 90.7% |
| Immigrants | Laos | 0.0 /100 | #284 | Tragic 90.5% |