Bahamian vs Immigrants from Ghana 11th Grade
COMPARE
Bahamian
Immigrants from Ghana
11th Grade
11th Grade Comparison
Bahamians
Immigrants from Ghana
91.6%
11TH GRADE
1.8/ 100
METRIC RATING
241st/ 347
METRIC RANK
91.2%
11TH GRADE
0.3/ 100
METRIC RATING
263rd/ 347
METRIC RANK
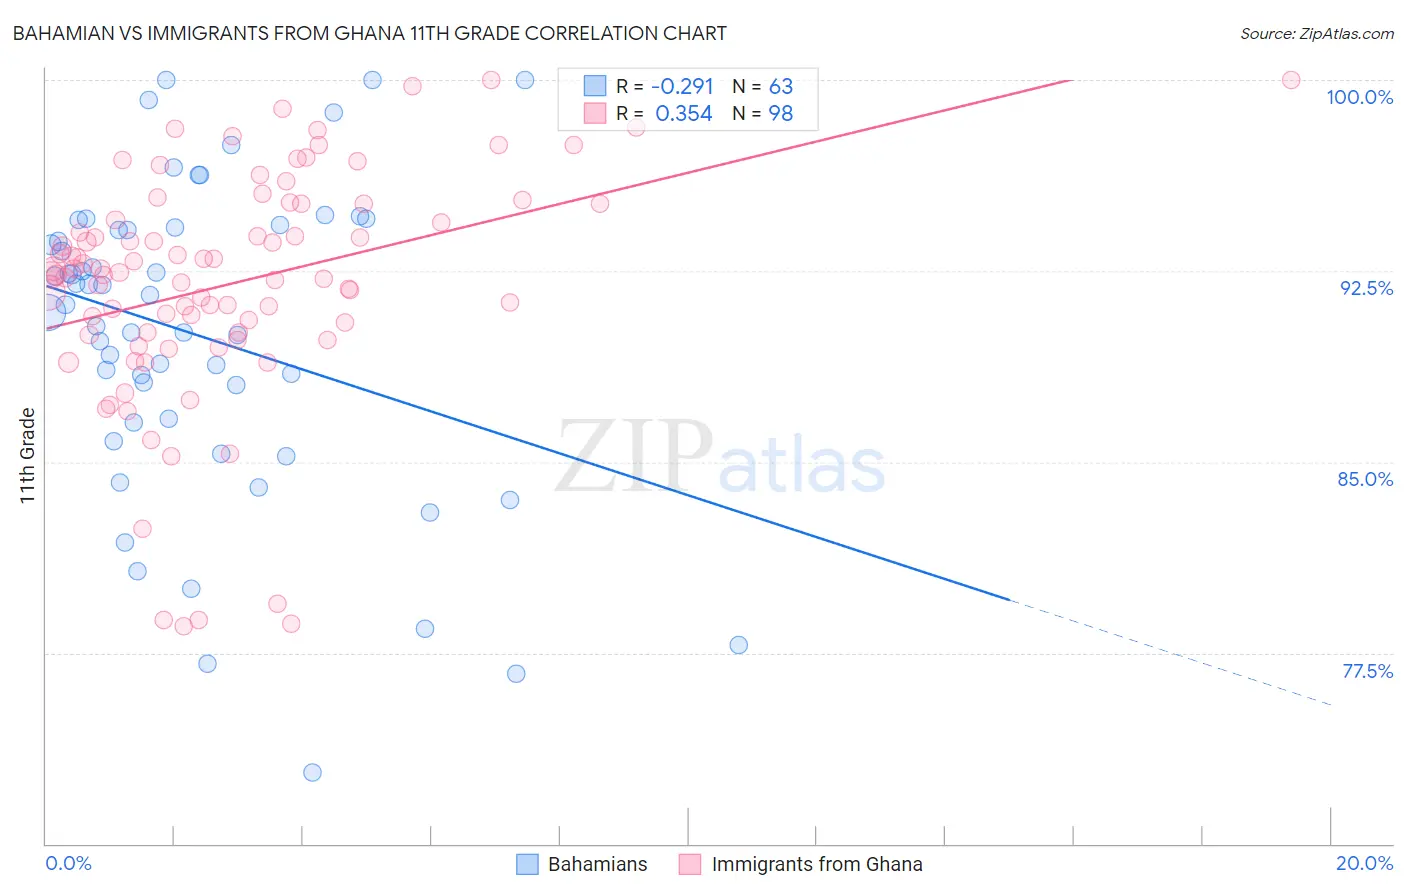
Bahamian vs Immigrants from Ghana 11th Grade Correlation Chart
The statistical analysis conducted on geographies consisting of 112,698,819 people shows a weak negative correlation between the proportion of Bahamians and percentage of population with at least 11th grade education in the United States with a correlation coefficient (R) of -0.291 and weighted average of 91.6%. Similarly, the statistical analysis conducted on geographies consisting of 199,951,730 people shows a mild positive correlation between the proportion of Immigrants from Ghana and percentage of population with at least 11th grade education in the United States with a correlation coefficient (R) of 0.354 and weighted average of 91.2%, a difference of 0.43%.
11th Grade Correlation Summary
| Measurement | Bahamian | Immigrants from Ghana |
| Minimum | 72.8% | 78.5% |
| Maximum | 100.0% | 100.0% |
| Range | 27.2% | 21.5% |
| Mean | 90.0% | 92.0% |
| Median | 91.2% | 92.4% |
| Interquartile 25% (IQ1) | 86.5% | 90.1% |
| Interquartile 75% (IQ3) | 94.2% | 95.1% |
| Interquartile Range (IQR) | 7.7% | 5.0% |
| Standard Deviation (Sample) | 6.1% | 4.6% |
| Standard Deviation (Population) | 6.1% | 4.6% |
Similar Demographics by 11th Grade
Demographics Similar to Bahamians by 11th Grade
In terms of 11th grade, the demographic groups most similar to Bahamians are South American (91.6%, a difference of 0.020%), Immigrants from Middle Africa (91.6%, a difference of 0.030%), Immigrants from Thailand (91.6%, a difference of 0.060%), Senegalese (91.6%, a difference of 0.070%), and Hopi (91.7%, a difference of 0.080%).
| Demographics | Rating | Rank | 11th Grade |
| Armenians | 2.9 /100 | #234 | Tragic 91.7% |
| Sub-Saharan Africans | 2.9 /100 | #235 | Tragic 91.7% |
| Colombians | 2.8 /100 | #236 | Tragic 91.7% |
| Immigrants | Bolivia | 2.8 /100 | #237 | Tragic 91.7% |
| Comanche | 2.6 /100 | #238 | Tragic 91.7% |
| Hopi | 2.5 /100 | #239 | Tragic 91.7% |
| South Americans | 2.0 /100 | #240 | Tragic 91.6% |
| Bahamians | 1.8 /100 | #241 | Tragic 91.6% |
| Immigrants | Middle Africa | 1.6 /100 | #242 | Tragic 91.6% |
| Immigrants | Thailand | 1.4 /100 | #243 | Tragic 91.6% |
| Senegalese | 1.4 /100 | #244 | Tragic 91.6% |
| Africans | 1.3 /100 | #245 | Tragic 91.5% |
| Seminole | 1.2 /100 | #246 | Tragic 91.5% |
| Immigrants | Philippines | 1.0 /100 | #247 | Tragic 91.5% |
| Immigrants | Uzbekistan | 1.0 /100 | #248 | Tragic 91.5% |
Demographics Similar to Immigrants from Ghana by 11th Grade
In terms of 11th grade, the demographic groups most similar to Immigrants from Ghana are Yup'ik (91.2%, a difference of 0.020%), Pueblo (91.2%, a difference of 0.020%), Immigrants from Western Africa (91.2%, a difference of 0.050%), Immigrants from Jamaica (91.2%, a difference of 0.050%), and Immigrants from Uruguay (91.3%, a difference of 0.13%).
| Demographics | Rating | Rank | 11th Grade |
| Immigrants | Senegal | 0.7 /100 | #256 | Tragic 91.4% |
| Cajuns | 0.7 /100 | #257 | Tragic 91.4% |
| Immigrants | Colombia | 0.6 /100 | #258 | Tragic 91.4% |
| Jamaicans | 0.6 /100 | #259 | Tragic 91.4% |
| Spanish Americans | 0.6 /100 | #260 | Tragic 91.4% |
| Taiwanese | 0.6 /100 | #261 | Tragic 91.3% |
| Immigrants | Uruguay | 0.5 /100 | #262 | Tragic 91.3% |
| Immigrants | Ghana | 0.3 /100 | #263 | Tragic 91.2% |
| Yup'ik | 0.3 /100 | #264 | Tragic 91.2% |
| Pueblo | 0.3 /100 | #265 | Tragic 91.2% |
| Immigrants | Western Africa | 0.3 /100 | #266 | Tragic 91.2% |
| Immigrants | Jamaica | 0.3 /100 | #267 | Tragic 91.2% |
| U.S. Virgin Islanders | 0.2 /100 | #268 | Tragic 91.1% |
| Ute | 0.2 /100 | #269 | Tragic 91.1% |
| Trinidadians and Tobagonians | 0.2 /100 | #270 | Tragic 91.1% |