Immigrants from Grenada vs Immigrants from Ghana 11th Grade
COMPARE
Immigrants from Grenada
Immigrants from Ghana
11th Grade
11th Grade Comparison
Immigrants from Grenada
Immigrants from Ghana
90.1%
11TH GRADE
0.0/ 100
METRIC RATING
294th/ 347
METRIC RANK
91.2%
11TH GRADE
0.3/ 100
METRIC RATING
263rd/ 347
METRIC RANK
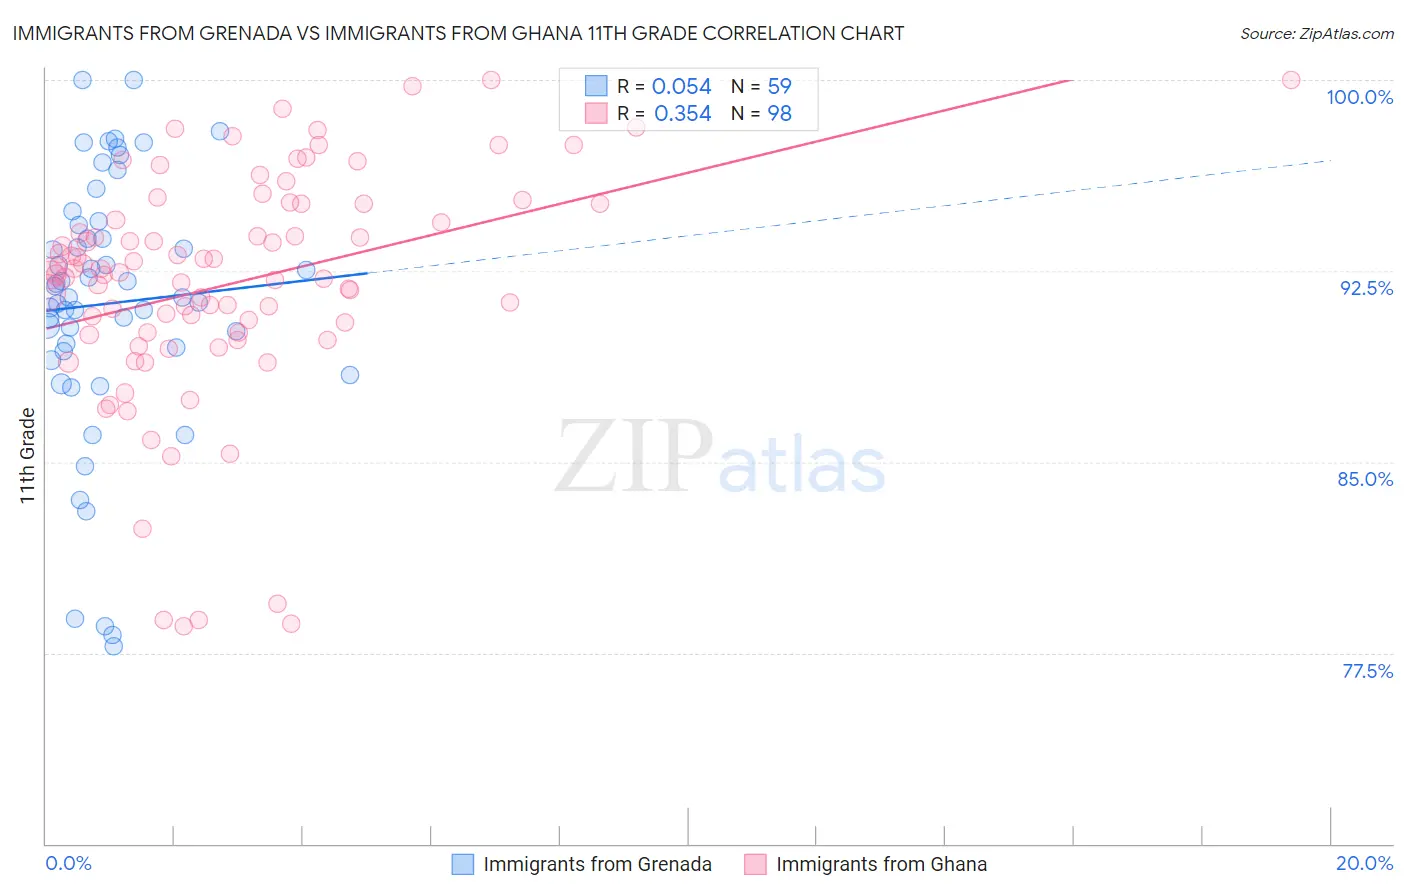
Immigrants from Grenada vs Immigrants from Ghana 11th Grade Correlation Chart
The statistical analysis conducted on geographies consisting of 67,201,908 people shows a slight positive correlation between the proportion of Immigrants from Grenada and percentage of population with at least 11th grade education in the United States with a correlation coefficient (R) of 0.054 and weighted average of 90.1%. Similarly, the statistical analysis conducted on geographies consisting of 199,951,730 people shows a mild positive correlation between the proportion of Immigrants from Ghana and percentage of population with at least 11th grade education in the United States with a correlation coefficient (R) of 0.354 and weighted average of 91.2%, a difference of 1.2%.
11th Grade Correlation Summary
| Measurement | Immigrants from Grenada | Immigrants from Ghana |
| Minimum | 77.8% | 78.5% |
| Maximum | 100.0% | 100.0% |
| Range | 22.2% | 21.5% |
| Mean | 91.2% | 92.0% |
| Median | 91.5% | 92.4% |
| Interquartile 25% (IQ1) | 89.4% | 90.1% |
| Interquartile 75% (IQ3) | 94.3% | 95.1% |
| Interquartile Range (IQR) | 5.0% | 5.0% |
| Standard Deviation (Sample) | 5.1% | 4.6% |
| Standard Deviation (Population) | 5.1% | 4.6% |
Similar Demographics by 11th Grade
Demographics Similar to Immigrants from Grenada by 11th Grade
In terms of 11th grade, the demographic groups most similar to Immigrants from Grenada are Native/Alaskan (90.2%, a difference of 0.050%), Immigrants from Vietnam (90.0%, a difference of 0.11%), Cuban (90.2%, a difference of 0.12%), Fijian (90.0%, a difference of 0.12%), and Haitian (90.3%, a difference of 0.14%).
| Demographics | Rating | Rank | 11th Grade |
| Apache | 0.0 /100 | #287 | Tragic 90.4% |
| Pennsylvania Germans | 0.0 /100 | #288 | Tragic 90.3% |
| British West Indians | 0.0 /100 | #289 | Tragic 90.3% |
| Indonesians | 0.0 /100 | #290 | Tragic 90.3% |
| Haitians | 0.0 /100 | #291 | Tragic 90.3% |
| Cubans | 0.0 /100 | #292 | Tragic 90.2% |
| Natives/Alaskans | 0.0 /100 | #293 | Tragic 90.2% |
| Immigrants | Grenada | 0.0 /100 | #294 | Tragic 90.1% |
| Immigrants | Vietnam | 0.0 /100 | #295 | Tragic 90.0% |
| Fijians | 0.0 /100 | #296 | Tragic 90.0% |
| Navajo | 0.0 /100 | #297 | Tragic 90.0% |
| Immigrants | Fiji | 0.0 /100 | #298 | Tragic 89.9% |
| Japanese | 0.0 /100 | #299 | Tragic 89.9% |
| Immigrants | Haiti | 0.0 /100 | #300 | Tragic 89.9% |
| Guyanese | 0.0 /100 | #301 | Tragic 89.9% |
Demographics Similar to Immigrants from Ghana by 11th Grade
In terms of 11th grade, the demographic groups most similar to Immigrants from Ghana are Yup'ik (91.2%, a difference of 0.020%), Pueblo (91.2%, a difference of 0.020%), Immigrants from Western Africa (91.2%, a difference of 0.050%), Immigrants from Jamaica (91.2%, a difference of 0.050%), and Immigrants from Uruguay (91.3%, a difference of 0.13%).
| Demographics | Rating | Rank | 11th Grade |
| Immigrants | Senegal | 0.7 /100 | #256 | Tragic 91.4% |
| Cajuns | 0.7 /100 | #257 | Tragic 91.4% |
| Immigrants | Colombia | 0.6 /100 | #258 | Tragic 91.4% |
| Jamaicans | 0.6 /100 | #259 | Tragic 91.4% |
| Spanish Americans | 0.6 /100 | #260 | Tragic 91.4% |
| Taiwanese | 0.6 /100 | #261 | Tragic 91.3% |
| Immigrants | Uruguay | 0.5 /100 | #262 | Tragic 91.3% |
| Immigrants | Ghana | 0.3 /100 | #263 | Tragic 91.2% |
| Yup'ik | 0.3 /100 | #264 | Tragic 91.2% |
| Pueblo | 0.3 /100 | #265 | Tragic 91.2% |
| Immigrants | Western Africa | 0.3 /100 | #266 | Tragic 91.2% |
| Immigrants | Jamaica | 0.3 /100 | #267 | Tragic 91.2% |
| U.S. Virgin Islanders | 0.2 /100 | #268 | Tragic 91.1% |
| Ute | 0.2 /100 | #269 | Tragic 91.1% |
| Trinidadians and Tobagonians | 0.2 /100 | #270 | Tragic 91.1% |