Peruvian vs British West Indian Nursery School
COMPARE
Peruvian
British West Indian
Nursery School
Nursery School Comparison
Peruvians
British West Indians
97.6%
NURSERY SCHOOL
1.0/ 100
METRIC RATING
246th/ 347
METRIC RANK
97.3%
NURSERY SCHOOL
0.0/ 100
METRIC RATING
291st/ 347
METRIC RANK
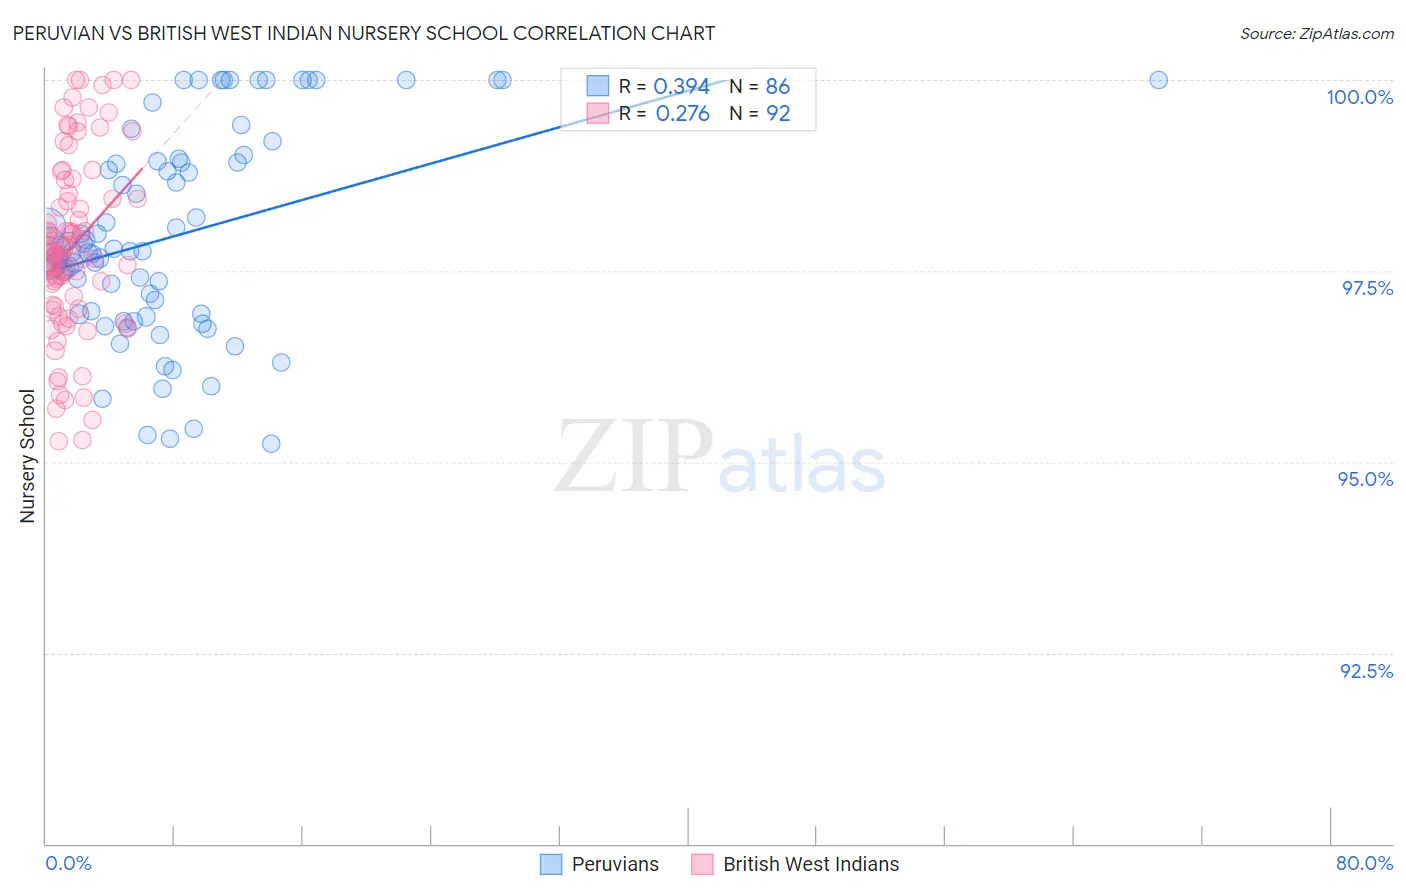
Peruvian vs British West Indian Nursery School Correlation Chart
The statistical analysis conducted on geographies consisting of 363,068,462 people shows a mild positive correlation between the proportion of Peruvians and percentage of population with at least nursery school education in the United States with a correlation coefficient (R) of 0.394 and weighted average of 97.6%. Similarly, the statistical analysis conducted on geographies consisting of 152,691,173 people shows a weak positive correlation between the proportion of British West Indians and percentage of population with at least nursery school education in the United States with a correlation coefficient (R) of 0.276 and weighted average of 97.3%, a difference of 0.36%.
Nursery School Correlation Summary
| Measurement | Peruvian | British West Indian |
| Minimum | 95.2% | 95.3% |
| Maximum | 100.0% | 100.0% |
| Range | 4.8% | 4.7% |
| Mean | 98.0% | 97.8% |
| Median | 97.8% | 97.7% |
| Interquartile 25% (IQ1) | 96.9% | 97.0% |
| Interquartile 75% (IQ3) | 98.9% | 98.5% |
| Interquartile Range (IQR) | 2.0% | 1.4% |
| Standard Deviation (Sample) | 1.3% | 1.2% |
| Standard Deviation (Population) | 1.3% | 1.2% |
Similar Demographics by Nursery School
Demographics Similar to Peruvians by Nursery School
In terms of nursery school, the demographic groups most similar to Peruvians are South American (97.6%, a difference of 0.0%), Bolivian (97.6%, a difference of 0.0%), Immigrants from Middle Africa (97.6%, a difference of 0.0%), Indian (Asian) (97.6%, a difference of 0.0%), and Immigrants from Indonesia (97.7%, a difference of 0.010%).
| Demographics | Rating | Rank | Nursery School |
| Immigrants | Eastern Asia | 1.6 /100 | #239 | Tragic 97.7% |
| Koreans | 1.4 /100 | #240 | Tragic 97.7% |
| Immigrants | Indonesia | 1.1 /100 | #241 | Tragic 97.7% |
| Liberians | 1.1 /100 | #242 | Tragic 97.7% |
| Asians | 1.1 /100 | #243 | Tragic 97.6% |
| South Americans | 1.0 /100 | #244 | Tragic 97.6% |
| Bolivians | 1.0 /100 | #245 | Tragic 97.6% |
| Peruvians | 1.0 /100 | #246 | Tragic 97.6% |
| Immigrants | Middle Africa | 0.9 /100 | #247 | Tragic 97.6% |
| Indians (Asian) | 0.9 /100 | #248 | Tragic 97.6% |
| Immigrants | Eastern Africa | 0.9 /100 | #249 | Tragic 97.6% |
| Immigrants | Senegal | 0.9 /100 | #250 | Tragic 97.6% |
| Ethiopians | 0.8 /100 | #251 | Tragic 97.6% |
| Immigrants | Africa | 0.8 /100 | #252 | Tragic 97.6% |
| Immigrants | Iraq | 0.7 /100 | #253 | Tragic 97.6% |
Demographics Similar to British West Indians by Nursery School
In terms of nursery school, the demographic groups most similar to British West Indians are Houma (97.3%, a difference of 0.020%), Immigrants from Afghanistan (97.3%, a difference of 0.030%), Malaysian (97.3%, a difference of 0.030%), Immigrants from St. Vincent and the Grenadines (97.3%, a difference of 0.040%), and Immigrants from Grenada (97.3%, a difference of 0.040%).
| Demographics | Rating | Rank | Nursery School |
| Immigrants | Trinidad and Tobago | 0.0 /100 | #284 | Tragic 97.4% |
| Immigrants | Barbados | 0.0 /100 | #285 | Tragic 97.4% |
| Immigrants | Portugal | 0.0 /100 | #286 | Tragic 97.4% |
| Immigrants | Hong Kong | 0.0 /100 | #287 | Tragic 97.4% |
| Immigrants | Thailand | 0.0 /100 | #288 | Tragic 97.3% |
| Immigrants | St. Vincent and the Grenadines | 0.0 /100 | #289 | Tragic 97.3% |
| Immigrants | Afghanistan | 0.0 /100 | #290 | Tragic 97.3% |
| British West Indians | 0.0 /100 | #291 | Tragic 97.3% |
| Houma | 0.0 /100 | #292 | Tragic 97.3% |
| Malaysians | 0.0 /100 | #293 | Tragic 97.3% |
| Immigrants | Grenada | 0.0 /100 | #294 | Tragic 97.3% |
| Immigrants | Immigrants | 0.0 /100 | #295 | Tragic 97.2% |
| Immigrants | Eritrea | 0.0 /100 | #296 | Tragic 97.2% |
| Immigrants | Cuba | 0.0 /100 | #297 | Tragic 97.2% |
| Central American Indians | 0.0 /100 | #298 | Tragic 97.2% |