Peruvian vs Maltese Nursery School
COMPARE
Peruvian
Maltese
Nursery School
Nursery School Comparison
Peruvians
Maltese
97.6%
NURSERY SCHOOL
1.0/ 100
METRIC RATING
246th/ 347
METRIC RANK
98.4%
NURSERY SCHOOL
99.7/ 100
METRIC RATING
65th/ 347
METRIC RANK
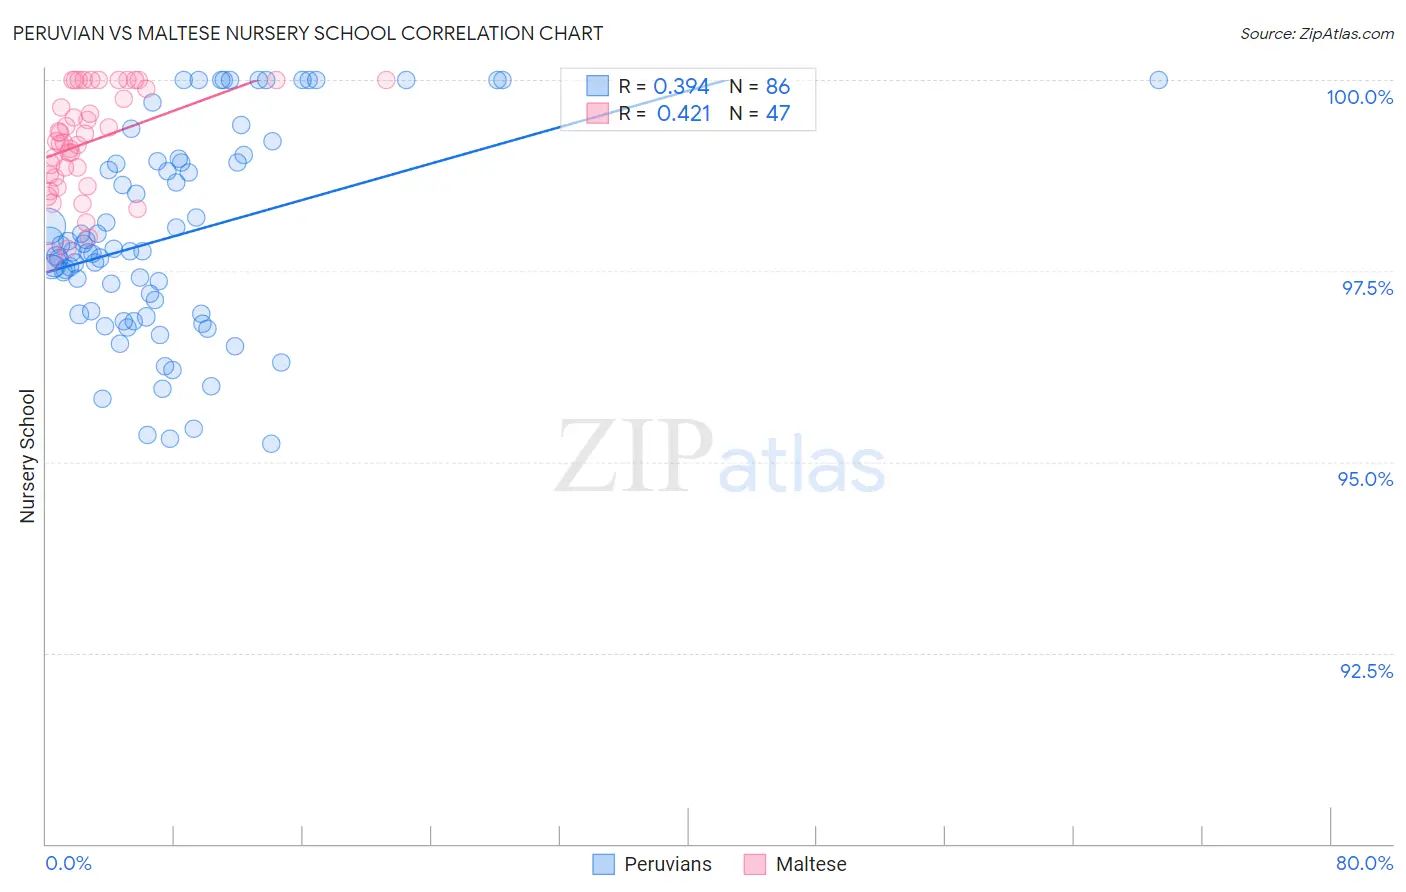
Peruvian vs Maltese Nursery School Correlation Chart
The statistical analysis conducted on geographies consisting of 363,068,462 people shows a mild positive correlation between the proportion of Peruvians and percentage of population with at least nursery school education in the United States with a correlation coefficient (R) of 0.394 and weighted average of 97.6%. Similarly, the statistical analysis conducted on geographies consisting of 126,476,608 people shows a moderate positive correlation between the proportion of Maltese and percentage of population with at least nursery school education in the United States with a correlation coefficient (R) of 0.421 and weighted average of 98.4%, a difference of 0.79%.
Nursery School Correlation Summary
| Measurement | Peruvian | Maltese |
| Minimum | 95.2% | 97.7% |
| Maximum | 100.0% | 100.0% |
| Range | 4.8% | 2.3% |
| Mean | 98.0% | 99.2% |
| Median | 97.8% | 99.2% |
| Interquartile 25% (IQ1) | 96.9% | 98.7% |
| Interquartile 75% (IQ3) | 98.9% | 100.0% |
| Interquartile Range (IQR) | 2.0% | 1.3% |
| Standard Deviation (Sample) | 1.3% | 0.67% |
| Standard Deviation (Population) | 1.3% | 0.66% |
Similar Demographics by Nursery School
Demographics Similar to Peruvians by Nursery School
In terms of nursery school, the demographic groups most similar to Peruvians are South American (97.6%, a difference of 0.0%), Bolivian (97.6%, a difference of 0.0%), Immigrants from Middle Africa (97.6%, a difference of 0.0%), Indian (Asian) (97.6%, a difference of 0.0%), and Immigrants from Indonesia (97.7%, a difference of 0.010%).
| Demographics | Rating | Rank | Nursery School |
| Immigrants | Eastern Asia | 1.6 /100 | #239 | Tragic 97.7% |
| Koreans | 1.4 /100 | #240 | Tragic 97.7% |
| Immigrants | Indonesia | 1.1 /100 | #241 | Tragic 97.7% |
| Liberians | 1.1 /100 | #242 | Tragic 97.7% |
| Asians | 1.1 /100 | #243 | Tragic 97.6% |
| South Americans | 1.0 /100 | #244 | Tragic 97.6% |
| Bolivians | 1.0 /100 | #245 | Tragic 97.6% |
| Peruvians | 1.0 /100 | #246 | Tragic 97.6% |
| Immigrants | Middle Africa | 0.9 /100 | #247 | Tragic 97.6% |
| Indians (Asian) | 0.9 /100 | #248 | Tragic 97.6% |
| Immigrants | Eastern Africa | 0.9 /100 | #249 | Tragic 97.6% |
| Immigrants | Senegal | 0.9 /100 | #250 | Tragic 97.6% |
| Ethiopians | 0.8 /100 | #251 | Tragic 97.6% |
| Immigrants | Africa | 0.8 /100 | #252 | Tragic 97.6% |
| Immigrants | Iraq | 0.7 /100 | #253 | Tragic 97.6% |
Demographics Similar to Maltese by Nursery School
In terms of nursery school, the demographic groups most similar to Maltese are New Zealander (98.4%, a difference of 0.0%), Creek (98.4%, a difference of 0.0%), Immigrants from North America (98.4%, a difference of 0.0%), Greek (98.4%, a difference of 0.0%), and Bulgarian (98.4%, a difference of 0.010%).
| Demographics | Rating | Rank | Nursery School |
| Bulgarians | 99.8 /100 | #58 | Exceptional 98.4% |
| Immigrants | Canada | 99.8 /100 | #59 | Exceptional 98.4% |
| Slavs | 99.8 /100 | #60 | Exceptional 98.4% |
| New Zealanders | 99.7 /100 | #61 | Exceptional 98.4% |
| Creek | 99.7 /100 | #62 | Exceptional 98.4% |
| Immigrants | North America | 99.7 /100 | #63 | Exceptional 98.4% |
| Greeks | 99.7 /100 | #64 | Exceptional 98.4% |
| Maltese | 99.7 /100 | #65 | Exceptional 98.4% |
| Canadians | 99.7 /100 | #66 | Exceptional 98.4% |
| Immigrants | Northern Europe | 99.6 /100 | #67 | Exceptional 98.4% |
| Russians | 99.6 /100 | #68 | Exceptional 98.4% |
| Immigrants | Austria | 99.6 /100 | #69 | Exceptional 98.4% |
| Cheyenne | 99.6 /100 | #70 | Exceptional 98.4% |
| Serbians | 99.6 /100 | #71 | Exceptional 98.4% |
| Chickasaw | 99.6 /100 | #72 | Exceptional 98.4% |