Peruvian vs Yuman Nursery School
COMPARE
Peruvian
Yuman
Nursery School
Nursery School Comparison
Peruvians
Yuman
97.6%
NURSERY SCHOOL
1.0/ 100
METRIC RATING
246th/ 347
METRIC RANK
97.9%
NURSERY SCHOOL
25.7/ 100
METRIC RATING
197th/ 347
METRIC RANK
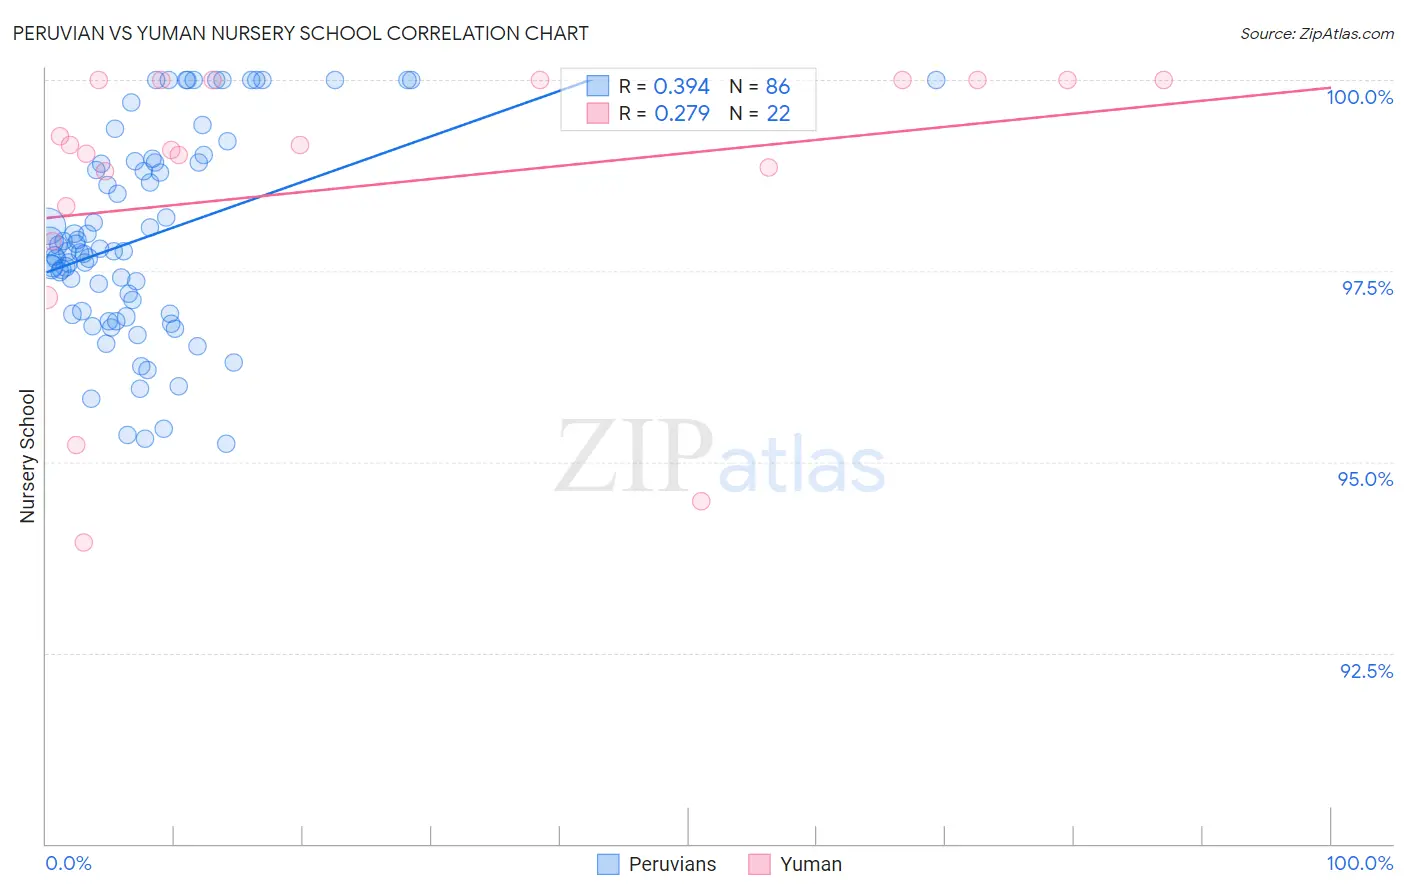
Peruvian vs Yuman Nursery School Correlation Chart
The statistical analysis conducted on geographies consisting of 363,068,462 people shows a mild positive correlation between the proportion of Peruvians and percentage of population with at least nursery school education in the United States with a correlation coefficient (R) of 0.394 and weighted average of 97.6%. Similarly, the statistical analysis conducted on geographies consisting of 40,696,229 people shows a weak positive correlation between the proportion of Yuman and percentage of population with at least nursery school education in the United States with a correlation coefficient (R) of 0.279 and weighted average of 97.9%, a difference of 0.27%.
Nursery School Correlation Summary
| Measurement | Peruvian | Yuman |
| Minimum | 95.2% | 93.9% |
| Maximum | 100.0% | 100.0% |
| Range | 4.8% | 6.1% |
| Mean | 98.0% | 98.6% |
| Median | 97.8% | 99.1% |
| Interquartile 25% (IQ1) | 96.9% | 98.3% |
| Interquartile 75% (IQ3) | 98.9% | 100.0% |
| Interquartile Range (IQR) | 2.0% | 1.7% |
| Standard Deviation (Sample) | 1.3% | 1.8% |
| Standard Deviation (Population) | 1.3% | 1.8% |
Similar Demographics by Nursery School
Demographics Similar to Peruvians by Nursery School
In terms of nursery school, the demographic groups most similar to Peruvians are South American (97.6%, a difference of 0.0%), Bolivian (97.6%, a difference of 0.0%), Immigrants from Middle Africa (97.6%, a difference of 0.0%), Indian (Asian) (97.6%, a difference of 0.0%), and Immigrants from Indonesia (97.7%, a difference of 0.010%).
| Demographics | Rating | Rank | Nursery School |
| Immigrants | Eastern Asia | 1.6 /100 | #239 | Tragic 97.7% |
| Koreans | 1.4 /100 | #240 | Tragic 97.7% |
| Immigrants | Indonesia | 1.1 /100 | #241 | Tragic 97.7% |
| Liberians | 1.1 /100 | #242 | Tragic 97.7% |
| Asians | 1.1 /100 | #243 | Tragic 97.6% |
| South Americans | 1.0 /100 | #244 | Tragic 97.6% |
| Bolivians | 1.0 /100 | #245 | Tragic 97.6% |
| Peruvians | 1.0 /100 | #246 | Tragic 97.6% |
| Immigrants | Middle Africa | 0.9 /100 | #247 | Tragic 97.6% |
| Indians (Asian) | 0.9 /100 | #248 | Tragic 97.6% |
| Immigrants | Eastern Africa | 0.9 /100 | #249 | Tragic 97.6% |
| Immigrants | Senegal | 0.9 /100 | #250 | Tragic 97.6% |
| Ethiopians | 0.8 /100 | #251 | Tragic 97.6% |
| Immigrants | Africa | 0.8 /100 | #252 | Tragic 97.6% |
| Immigrants | Iraq | 0.7 /100 | #253 | Tragic 97.6% |
Demographics Similar to Yuman by Nursery School
In terms of nursery school, the demographic groups most similar to Yuman are Guamanian/Chamorro (97.9%, a difference of 0.0%), Black/African American (97.9%, a difference of 0.010%), Paraguayan (97.9%, a difference of 0.010%), Mongolian (97.9%, a difference of 0.010%), and Hawaiian (97.9%, a difference of 0.010%).
| Demographics | Rating | Rank | Nursery School |
| Panamanians | 34.3 /100 | #190 | Fair 97.9% |
| Immigrants | Taiwan | 30.6 /100 | #191 | Fair 97.9% |
| Blacks/African Americans | 29.4 /100 | #192 | Fair 97.9% |
| Paraguayans | 27.4 /100 | #193 | Fair 97.9% |
| Mongolians | 27.3 /100 | #194 | Fair 97.9% |
| Hawaiians | 27.2 /100 | #195 | Fair 97.9% |
| Guamanians/Chamorros | 25.7 /100 | #196 | Fair 97.9% |
| Yuman | 25.7 /100 | #197 | Fair 97.9% |
| Immigrants | Kenya | 24.1 /100 | #198 | Fair 97.9% |
| Immigrants | Egypt | 22.5 /100 | #199 | Fair 97.9% |
| Tohono O'odham | 22.2 /100 | #200 | Fair 97.9% |
| Immigrants | Lebanon | 21.2 /100 | #201 | Fair 97.9% |
| Immigrants | Ukraine | 19.9 /100 | #202 | Poor 97.9% |
| Immigrants | Uganda | 18.0 /100 | #203 | Poor 97.9% |
| Immigrants | Southern Europe | 17.4 /100 | #204 | Poor 97.9% |