Immigrants from Uganda vs British West Indian Nursery School
COMPARE
Immigrants from Uganda
British West Indian
Nursery School
Nursery School Comparison
Immigrants from Uganda
British West Indians
97.9%
NURSERY SCHOOL
18.0/ 100
METRIC RATING
203rd/ 347
METRIC RANK
97.3%
NURSERY SCHOOL
0.0/ 100
METRIC RATING
291st/ 347
METRIC RANK
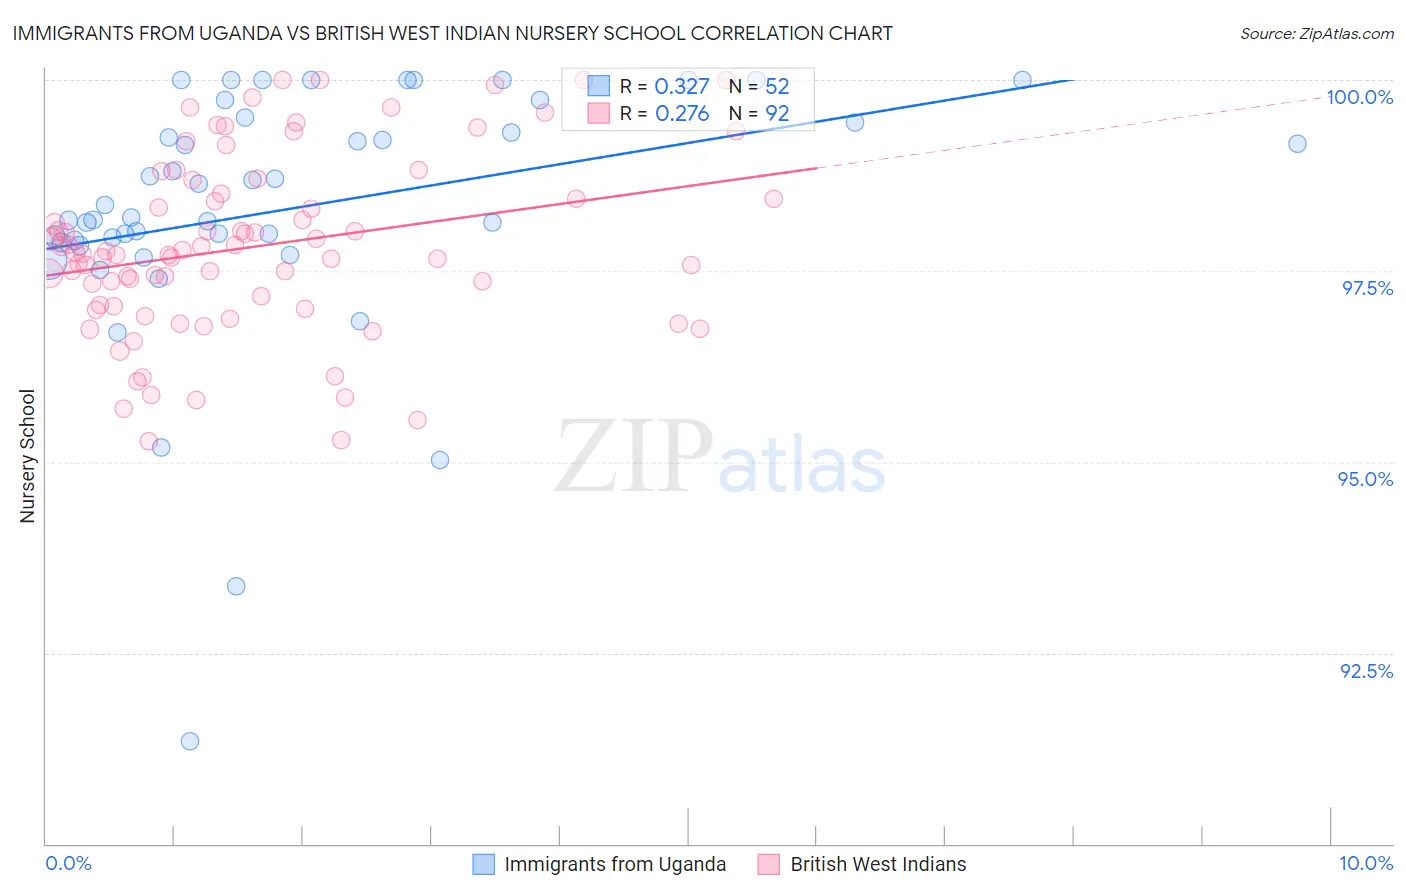
Immigrants from Uganda vs British West Indian Nursery School Correlation Chart
The statistical analysis conducted on geographies consisting of 125,941,298 people shows a mild positive correlation between the proportion of Immigrants from Uganda and percentage of population with at least nursery school education in the United States with a correlation coefficient (R) of 0.327 and weighted average of 97.9%. Similarly, the statistical analysis conducted on geographies consisting of 152,691,173 people shows a weak positive correlation between the proportion of British West Indians and percentage of population with at least nursery school education in the United States with a correlation coefficient (R) of 0.276 and weighted average of 97.3%, a difference of 0.59%.
Nursery School Correlation Summary
| Measurement | Immigrants from Uganda | British West Indian |
| Minimum | 91.3% | 95.3% |
| Maximum | 100.0% | 100.0% |
| Range | 8.7% | 4.7% |
| Mean | 98.3% | 97.8% |
| Median | 98.3% | 97.7% |
| Interquartile 25% (IQ1) | 97.9% | 97.0% |
| Interquartile 75% (IQ3) | 99.5% | 98.5% |
| Interquartile Range (IQR) | 1.6% | 1.4% |
| Standard Deviation (Sample) | 1.7% | 1.2% |
| Standard Deviation (Population) | 1.7% | 1.2% |
Similar Demographics by Nursery School
Demographics Similar to Immigrants from Uganda by Nursery School
In terms of nursery school, the demographic groups most similar to Immigrants from Uganda are Immigrants from Southern Europe (97.9%, a difference of 0.0%), Immigrants from Chile (97.9%, a difference of 0.0%), Immigrants from Ukraine (97.9%, a difference of 0.010%), Immigrants from Albania (97.9%, a difference of 0.010%), and African (97.9%, a difference of 0.010%).
| Demographics | Rating | Rank | Nursery School |
| Guamanians/Chamorros | 25.7 /100 | #196 | Fair 97.9% |
| Yuman | 25.7 /100 | #197 | Fair 97.9% |
| Immigrants | Kenya | 24.1 /100 | #198 | Fair 97.9% |
| Immigrants | Egypt | 22.5 /100 | #199 | Fair 97.9% |
| Tohono O'odham | 22.2 /100 | #200 | Fair 97.9% |
| Immigrants | Lebanon | 21.2 /100 | #201 | Fair 97.9% |
| Immigrants | Ukraine | 19.9 /100 | #202 | Poor 97.9% |
| Immigrants | Uganda | 18.0 /100 | #203 | Poor 97.9% |
| Immigrants | Southern Europe | 17.4 /100 | #204 | Poor 97.9% |
| Immigrants | Chile | 17.3 /100 | #205 | Poor 97.9% |
| Immigrants | Albania | 16.4 /100 | #206 | Poor 97.9% |
| Africans | 15.4 /100 | #207 | Poor 97.9% |
| Immigrants | Northern Africa | 11.7 /100 | #208 | Poor 97.8% |
| Costa Ricans | 11.3 /100 | #209 | Poor 97.8% |
| Immigrants | Oceania | 10.2 /100 | #210 | Poor 97.8% |
Demographics Similar to British West Indians by Nursery School
In terms of nursery school, the demographic groups most similar to British West Indians are Houma (97.3%, a difference of 0.020%), Immigrants from Afghanistan (97.3%, a difference of 0.030%), Malaysian (97.3%, a difference of 0.030%), Immigrants from St. Vincent and the Grenadines (97.3%, a difference of 0.040%), and Immigrants from Grenada (97.3%, a difference of 0.040%).
| Demographics | Rating | Rank | Nursery School |
| Immigrants | Trinidad and Tobago | 0.0 /100 | #284 | Tragic 97.4% |
| Immigrants | Barbados | 0.0 /100 | #285 | Tragic 97.4% |
| Immigrants | Portugal | 0.0 /100 | #286 | Tragic 97.4% |
| Immigrants | Hong Kong | 0.0 /100 | #287 | Tragic 97.4% |
| Immigrants | Thailand | 0.0 /100 | #288 | Tragic 97.3% |
| Immigrants | St. Vincent and the Grenadines | 0.0 /100 | #289 | Tragic 97.3% |
| Immigrants | Afghanistan | 0.0 /100 | #290 | Tragic 97.3% |
| British West Indians | 0.0 /100 | #291 | Tragic 97.3% |
| Houma | 0.0 /100 | #292 | Tragic 97.3% |
| Malaysians | 0.0 /100 | #293 | Tragic 97.3% |
| Immigrants | Grenada | 0.0 /100 | #294 | Tragic 97.3% |
| Immigrants | Immigrants | 0.0 /100 | #295 | Tragic 97.2% |
| Immigrants | Eritrea | 0.0 /100 | #296 | Tragic 97.2% |
| Immigrants | Cuba | 0.0 /100 | #297 | Tragic 97.2% |
| Central American Indians | 0.0 /100 | #298 | Tragic 97.2% |