Zimbabwean vs British West Indian Nursery School
COMPARE
Zimbabwean
British West Indian
Nursery School
Nursery School Comparison
Zimbabweans
British West Indians
98.3%
NURSERY SCHOOL
98.8/ 100
METRIC RATING
91st/ 347
METRIC RANK
97.3%
NURSERY SCHOOL
0.0/ 100
METRIC RATING
291st/ 347
METRIC RANK
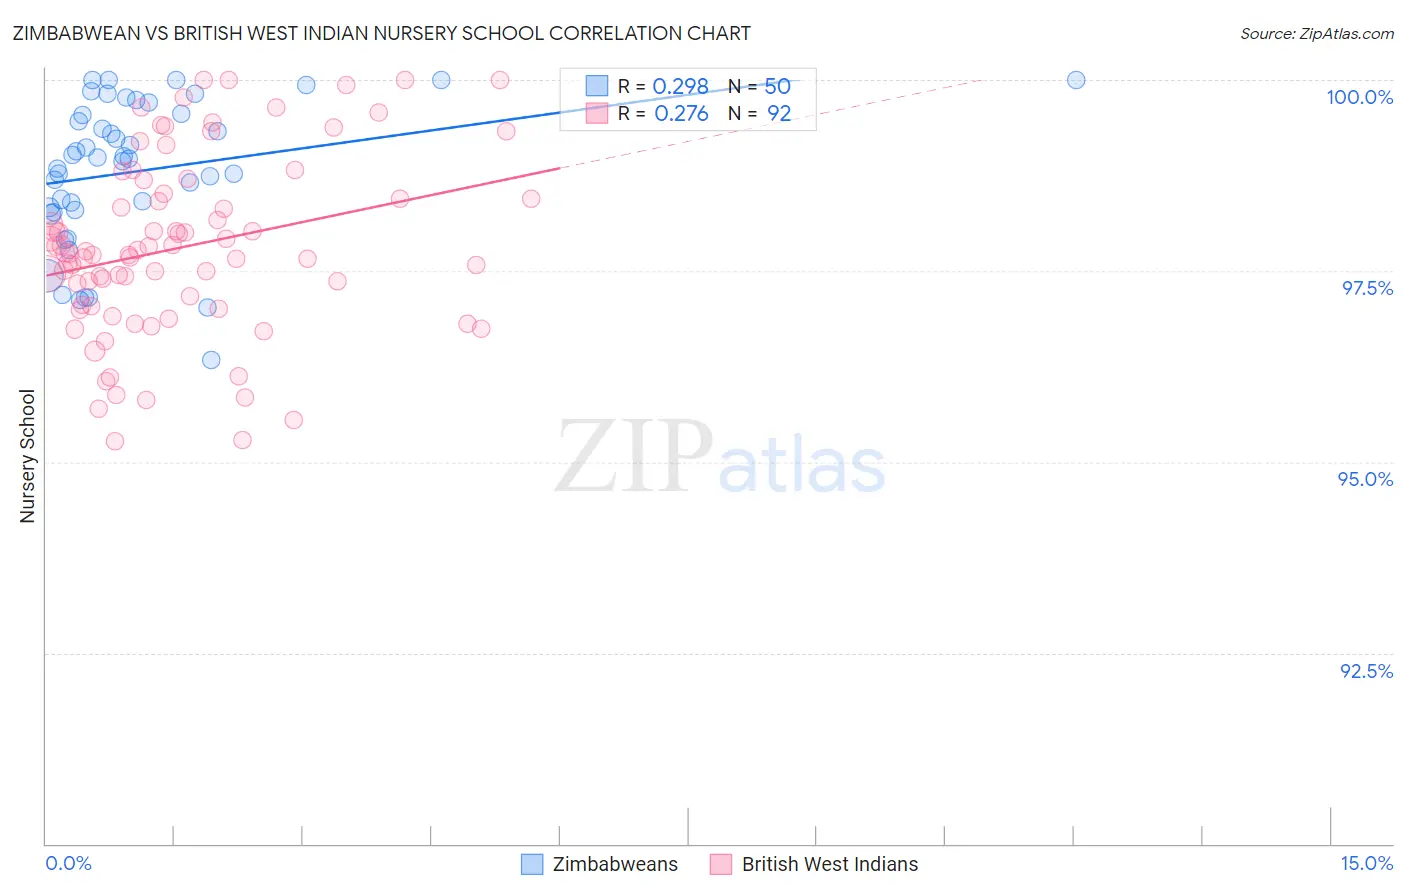
Zimbabwean vs British West Indian Nursery School Correlation Chart
The statistical analysis conducted on geographies consisting of 69,200,462 people shows a weak positive correlation between the proportion of Zimbabweans and percentage of population with at least nursery school education in the United States with a correlation coefficient (R) of 0.298 and weighted average of 98.3%. Similarly, the statistical analysis conducted on geographies consisting of 152,691,173 people shows a weak positive correlation between the proportion of British West Indians and percentage of population with at least nursery school education in the United States with a correlation coefficient (R) of 0.276 and weighted average of 97.3%, a difference of 1.0%.
Nursery School Correlation Summary
| Measurement | Zimbabwean | British West Indian |
| Minimum | 96.3% | 95.3% |
| Maximum | 100.0% | 100.0% |
| Range | 3.7% | 4.7% |
| Mean | 98.8% | 97.8% |
| Median | 99.0% | 97.7% |
| Interquartile 25% (IQ1) | 98.3% | 97.0% |
| Interquartile 75% (IQ3) | 99.6% | 98.5% |
| Interquartile Range (IQR) | 1.3% | 1.4% |
| Standard Deviation (Sample) | 0.94% | 1.2% |
| Standard Deviation (Population) | 0.93% | 1.2% |
Similar Demographics by Nursery School
Demographics Similar to Zimbabweans by Nursery School
In terms of nursery school, the demographic groups most similar to Zimbabweans are Hopi (98.3%, a difference of 0.0%), Ukrainian (98.3%, a difference of 0.0%), Immigrants from South Africa (98.3%, a difference of 0.0%), Immigrants from Western Europe (98.3%, a difference of 0.0%), and Macedonian (98.3%, a difference of 0.0%).
| Demographics | Rating | Rank | Nursery School |
| Immigrants | Denmark | 99.1 /100 | #84 | Exceptional 98.3% |
| Immigrants | Sweden | 99.1 /100 | #85 | Exceptional 98.3% |
| Immigrants | Australia | 99.0 /100 | #86 | Exceptional 98.3% |
| Hopi | 98.9 /100 | #87 | Exceptional 98.3% |
| Ukrainians | 98.9 /100 | #88 | Exceptional 98.3% |
| Immigrants | South Africa | 98.8 /100 | #89 | Exceptional 98.3% |
| Immigrants | Western Europe | 98.8 /100 | #90 | Exceptional 98.3% |
| Zimbabweans | 98.8 /100 | #91 | Exceptional 98.3% |
| Macedonians | 98.7 /100 | #92 | Exceptional 98.3% |
| Immigrants | India | 98.7 /100 | #93 | Exceptional 98.3% |
| Immigrants | Germany | 98.6 /100 | #94 | Exceptional 98.3% |
| South Africans | 98.6 /100 | #95 | Exceptional 98.3% |
| Cypriots | 98.3 /100 | #96 | Exceptional 98.3% |
| Immigrants | Nonimmigrants | 98.3 /100 | #97 | Exceptional 98.3% |
| Choctaw | 98.3 /100 | #98 | Exceptional 98.3% |
Demographics Similar to British West Indians by Nursery School
In terms of nursery school, the demographic groups most similar to British West Indians are Houma (97.3%, a difference of 0.020%), Immigrants from Afghanistan (97.3%, a difference of 0.030%), Malaysian (97.3%, a difference of 0.030%), Immigrants from St. Vincent and the Grenadines (97.3%, a difference of 0.040%), and Immigrants from Grenada (97.3%, a difference of 0.040%).
| Demographics | Rating | Rank | Nursery School |
| Immigrants | Trinidad and Tobago | 0.0 /100 | #284 | Tragic 97.4% |
| Immigrants | Barbados | 0.0 /100 | #285 | Tragic 97.4% |
| Immigrants | Portugal | 0.0 /100 | #286 | Tragic 97.4% |
| Immigrants | Hong Kong | 0.0 /100 | #287 | Tragic 97.4% |
| Immigrants | Thailand | 0.0 /100 | #288 | Tragic 97.3% |
| Immigrants | St. Vincent and the Grenadines | 0.0 /100 | #289 | Tragic 97.3% |
| Immigrants | Afghanistan | 0.0 /100 | #290 | Tragic 97.3% |
| British West Indians | 0.0 /100 | #291 | Tragic 97.3% |
| Houma | 0.0 /100 | #292 | Tragic 97.3% |
| Malaysians | 0.0 /100 | #293 | Tragic 97.3% |
| Immigrants | Grenada | 0.0 /100 | #294 | Tragic 97.3% |
| Immigrants | Immigrants | 0.0 /100 | #295 | Tragic 97.2% |
| Immigrants | Eritrea | 0.0 /100 | #296 | Tragic 97.2% |
| Immigrants | Cuba | 0.0 /100 | #297 | Tragic 97.2% |
| Central American Indians | 0.0 /100 | #298 | Tragic 97.2% |