Peruvian vs British West Indian Unemployment Among Women with Children Ages 6 to 17 years
COMPARE
Peruvian
British West Indian
Unemployment Among Women with Children Ages 6 to 17 years
Unemployment Among Women with Children Ages 6 to 17 years Comparison
Peruvians
British West Indians
9.2%
UNEMPLOYMENT AMONG WOMEN WITH CHILDREN AGES 6 TO 17 YEARS
9.0/ 100
METRIC RATING
212th/ 347
METRIC RANK
9.7%
UNEMPLOYMENT AMONG WOMEN WITH CHILDREN AGES 6 TO 17 YEARS
0.1/ 100
METRIC RATING
277th/ 347
METRIC RANK
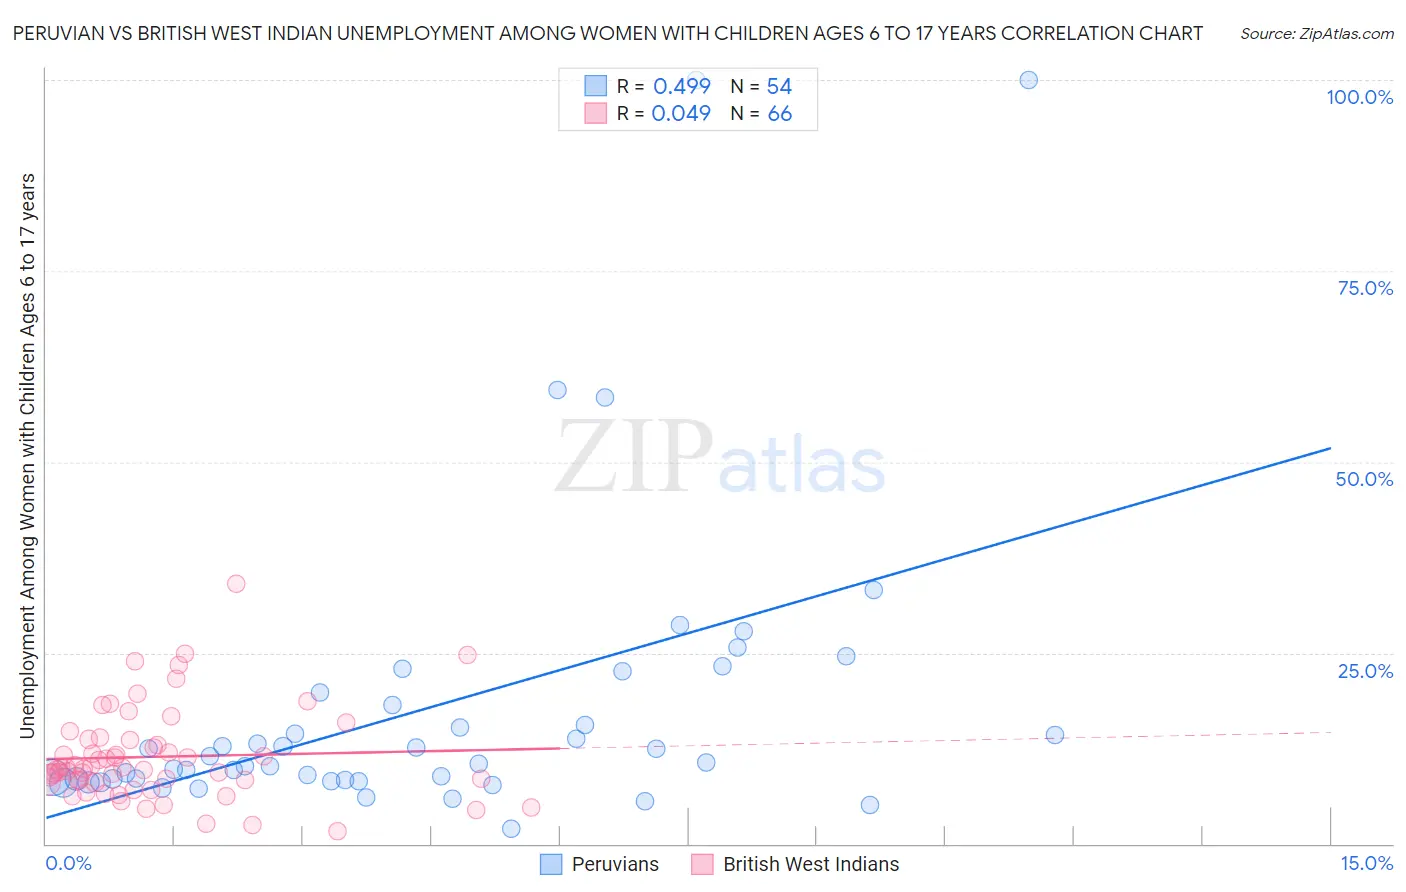
Peruvian vs British West Indian Unemployment Among Women with Children Ages 6 to 17 years Correlation Chart
The statistical analysis conducted on geographies consisting of 270,138,716 people shows a moderate positive correlation between the proportion of Peruvians and unemployment rate among women with children between the ages 6 and 17 in the United States with a correlation coefficient (R) of 0.499 and weighted average of 9.2%. Similarly, the statistical analysis conducted on geographies consisting of 128,120,718 people shows no correlation between the proportion of British West Indians and unemployment rate among women with children between the ages 6 and 17 in the United States with a correlation coefficient (R) of 0.049 and weighted average of 9.7%, a difference of 5.4%.
Unemployment Among Women with Children Ages 6 to 17 years Correlation Summary
| Measurement | Peruvian | British West Indian |
| Minimum | 1.9% | 1.6% |
| Maximum | 100.0% | 34.1% |
| Range | 98.1% | 32.5% |
| Mean | 17.6% | 11.4% |
| Median | 10.6% | 9.9% |
| Interquartile 25% (IQ1) | 8.3% | 8.2% |
| Interquartile 75% (IQ3) | 18.2% | 13.5% |
| Interquartile Range (IQR) | 9.9% | 5.4% |
| Standard Deviation (Sample) | 19.7% | 6.0% |
| Standard Deviation (Population) | 19.5% | 6.0% |
Similar Demographics by Unemployment Among Women with Children Ages 6 to 17 years
Demographics Similar to Peruvians by Unemployment Among Women with Children Ages 6 to 17 years
In terms of unemployment among women with children ages 6 to 17 years, the demographic groups most similar to Peruvians are Immigrants from Cuba (9.2%, a difference of 0.080%), Spaniard (9.2%, a difference of 0.11%), Finnish (9.2%, a difference of 0.13%), Iroquois (9.2%, a difference of 0.21%), and Immigrants from Peru (9.2%, a difference of 0.22%).
| Demographics | Rating | Rank | Unemployment Among Women with Children Ages 6 to 17 years |
| Immigrants | Western Europe | 14.1 /100 | #205 | Poor 9.1% |
| Immigrants | North America | 12.7 /100 | #206 | Poor 9.2% |
| Cubans | 10.9 /100 | #207 | Poor 9.2% |
| Immigrants | Peru | 10.8 /100 | #208 | Poor 9.2% |
| Salvadorans | 10.7 /100 | #209 | Poor 9.2% |
| Finns | 10.0 /100 | #210 | Tragic 9.2% |
| Immigrants | Cuba | 9.6 /100 | #211 | Tragic 9.2% |
| Peruvians | 9.0 /100 | #212 | Tragic 9.2% |
| Spaniards | 8.2 /100 | #213 | Tragic 9.2% |
| Iroquois | 7.5 /100 | #214 | Tragic 9.2% |
| Immigrants | Germany | 7.2 /100 | #215 | Tragic 9.2% |
| Immigrants | Uruguay | 7.2 /100 | #216 | Tragic 9.2% |
| Germans | 7.2 /100 | #217 | Tragic 9.2% |
| Syrians | 6.9 /100 | #218 | Tragic 9.2% |
| Immigrants | Scotland | 6.6 /100 | #219 | Tragic 9.2% |
Demographics Similar to British West Indians by Unemployment Among Women with Children Ages 6 to 17 years
In terms of unemployment among women with children ages 6 to 17 years, the demographic groups most similar to British West Indians are Immigrants from Portugal (9.7%, a difference of 0.050%), U.S. Virgin Islander (9.7%, a difference of 0.060%), French (9.7%, a difference of 0.070%), Scotch-Irish (9.7%, a difference of 0.11%), and Seminole (9.7%, a difference of 0.29%).
| Demographics | Rating | Rank | Unemployment Among Women with Children Ages 6 to 17 years |
| Immigrants | Nicaragua | 0.2 /100 | #270 | Tragic 9.6% |
| Immigrants | Latin America | 0.1 /100 | #271 | Tragic 9.6% |
| Kiowa | 0.1 /100 | #272 | Tragic 9.6% |
| Whites/Caucasians | 0.1 /100 | #273 | Tragic 9.6% |
| Aleuts | 0.1 /100 | #274 | Tragic 9.6% |
| U.S. Virgin Islanders | 0.1 /100 | #275 | Tragic 9.7% |
| Immigrants | Portugal | 0.1 /100 | #276 | Tragic 9.7% |
| British West Indians | 0.1 /100 | #277 | Tragic 9.7% |
| French | 0.1 /100 | #278 | Tragic 9.7% |
| Scotch-Irish | 0.1 /100 | #279 | Tragic 9.7% |
| Seminole | 0.1 /100 | #280 | Tragic 9.7% |
| Jamaicans | 0.0 /100 | #281 | Tragic 9.8% |
| Slovaks | 0.0 /100 | #282 | Tragic 9.8% |
| Central American Indians | 0.0 /100 | #283 | Tragic 9.9% |
| Yakama | 0.0 /100 | #284 | Tragic 9.9% |