Paraguayan vs Chippewa Currently Married
COMPARE
Paraguayan
Chippewa
Currently Married
Currently Married Comparison
Paraguayans
Chippewa
47.2%
CURRENTLY MARRIED
77.8/ 100
METRIC RATING
137th/ 347
METRIC RANK
43.2%
CURRENTLY MARRIED
0.0/ 100
METRIC RATING
281st/ 347
METRIC RANK
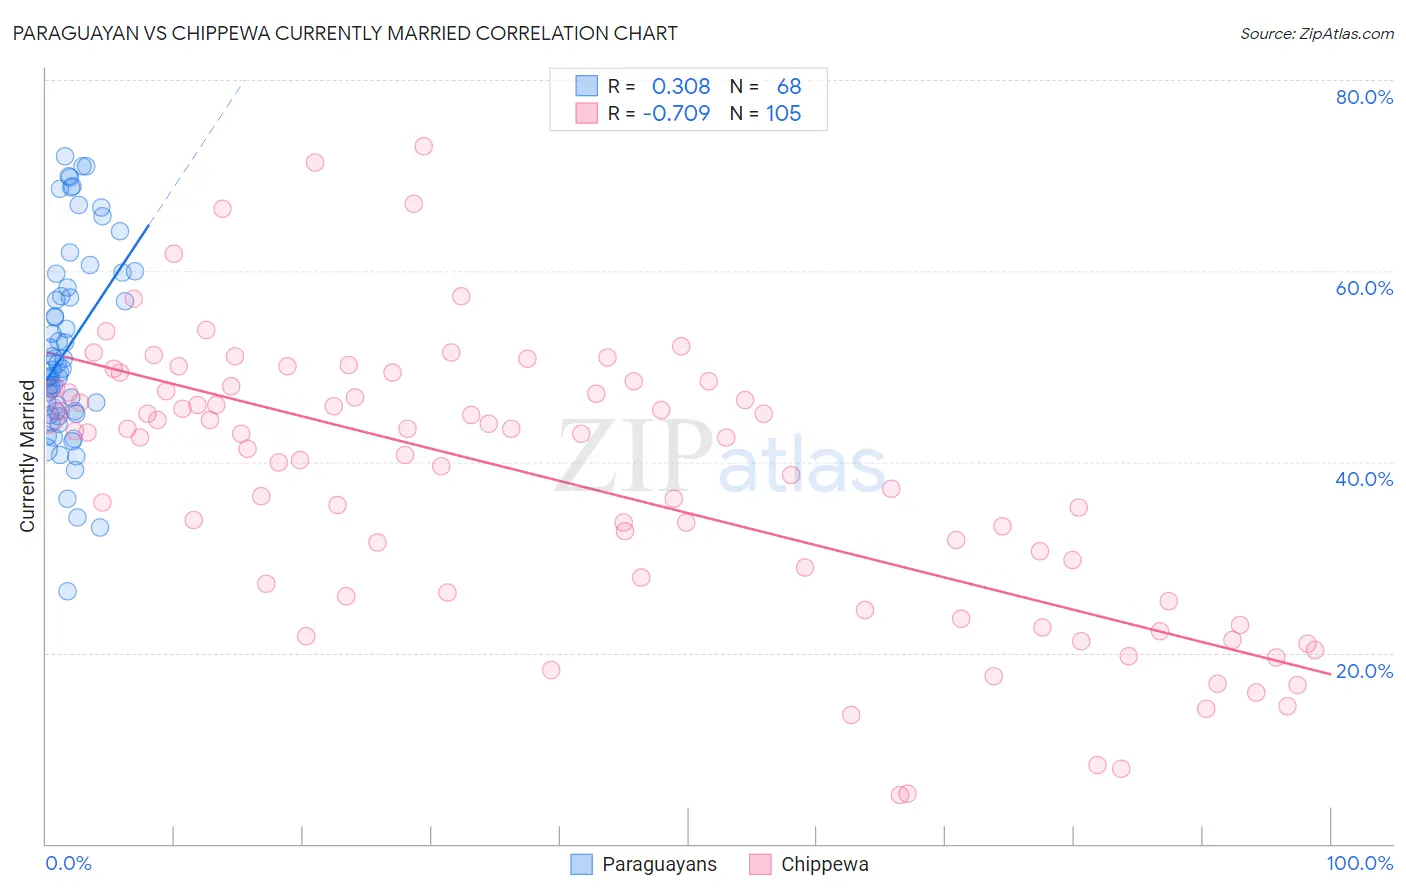
Paraguayan vs Chippewa Currently Married Correlation Chart
The statistical analysis conducted on geographies consisting of 95,115,093 people shows a mild positive correlation between the proportion of Paraguayans and percentage of population currently married in the United States with a correlation coefficient (R) of 0.308 and weighted average of 47.2%. Similarly, the statistical analysis conducted on geographies consisting of 215,057,083 people shows a strong negative correlation between the proportion of Chippewa and percentage of population currently married in the United States with a correlation coefficient (R) of -0.709 and weighted average of 43.2%, a difference of 9.1%.
Currently Married Correlation Summary
| Measurement | Paraguayan | Chippewa |
| Minimum | 26.5% | 5.1% |
| Maximum | 71.9% | 73.1% |
| Range | 45.4% | 68.0% |
| Mean | 52.0% | 38.0% |
| Median | 49.7% | 42.5% |
| Interquartile 25% (IQ1) | 45.2% | 26.1% |
| Interquartile 75% (IQ3) | 58.9% | 47.6% |
| Interquartile Range (IQR) | 13.8% | 21.5% |
| Standard Deviation (Sample) | 10.2% | 14.5% |
| Standard Deviation (Population) | 10.2% | 14.4% |
Similar Demographics by Currently Married
Demographics Similar to Paraguayans by Currently Married
In terms of currently married, the demographic groups most similar to Paraguayans are Immigrants from Vietnam (47.2%, a difference of 0.020%), Pakistani (47.2%, a difference of 0.020%), Yugoslavian (47.2%, a difference of 0.020%), Immigrants from Norway (47.2%, a difference of 0.10%), and Cajun (47.1%, a difference of 0.13%).
| Demographics | Rating | Rank | Currently Married |
| Immigrants | Iraq | 82.8 /100 | #130 | Excellent 47.3% |
| Icelanders | 82.4 /100 | #131 | Excellent 47.3% |
| Afghans | 81.8 /100 | #132 | Excellent 47.3% |
| Immigrants | Malaysia | 81.1 /100 | #133 | Excellent 47.3% |
| Immigrants | Australia | 81.1 /100 | #134 | Excellent 47.3% |
| Immigrants | Norway | 79.7 /100 | #135 | Good 47.2% |
| Immigrants | Vietnam | 78.2 /100 | #136 | Good 47.2% |
| Paraguayans | 77.8 /100 | #137 | Good 47.2% |
| Pakistanis | 77.5 /100 | #138 | Good 47.2% |
| Yugoslavians | 77.4 /100 | #139 | Good 47.2% |
| Cajuns | 75.3 /100 | #140 | Good 47.1% |
| Venezuelans | 74.4 /100 | #141 | Good 47.1% |
| Argentineans | 74.4 /100 | #142 | Good 47.1% |
| Guamanians/Chamorros | 74.2 /100 | #143 | Good 47.1% |
| Hmong | 73.4 /100 | #144 | Good 47.1% |
Demographics Similar to Chippewa by Currently Married
In terms of currently married, the demographic groups most similar to Chippewa are Apache (43.2%, a difference of 0.010%), Immigrants from Ecuador (43.2%, a difference of 0.070%), Central American Indian (43.3%, a difference of 0.080%), Kiowa (43.2%, a difference of 0.19%), and Immigrants from El Salvador (43.1%, a difference of 0.20%).
| Demographics | Rating | Rank | Currently Married |
| Nigerians | 0.1 /100 | #274 | Tragic 43.4% |
| Colville | 0.1 /100 | #275 | Tragic 43.4% |
| Sierra Leoneans | 0.1 /100 | #276 | Tragic 43.4% |
| Immigrants | Nigeria | 0.1 /100 | #277 | Tragic 43.4% |
| Central Americans | 0.0 /100 | #278 | Tragic 43.3% |
| Central American Indians | 0.0 /100 | #279 | Tragic 43.3% |
| Apache | 0.0 /100 | #280 | Tragic 43.2% |
| Chippewa | 0.0 /100 | #281 | Tragic 43.2% |
| Immigrants | Ecuador | 0.0 /100 | #282 | Tragic 43.2% |
| Kiowa | 0.0 /100 | #283 | Tragic 43.2% |
| Immigrants | El Salvador | 0.0 /100 | #284 | Tragic 43.1% |
| Immigrants | Middle Africa | 0.0 /100 | #285 | Tragic 43.0% |
| Ghanaians | 0.0 /100 | #286 | Tragic 42.9% |
| Guatemalans | 0.0 /100 | #287 | Tragic 42.9% |
| Natives/Alaskans | 0.0 /100 | #288 | Tragic 42.8% |