Hmong vs Syrian GED/Equivalency
COMPARE
Hmong
Syrian
GED/Equivalency
GED/Equivalency Comparison
Hmong
Syrians
84.9%
GED/EQUIVALENCY
13.1/ 100
METRIC RATING
207th/ 347
METRIC RANK
87.2%
GED/EQUIVALENCY
96.6/ 100
METRIC RATING
101st/ 347
METRIC RANK
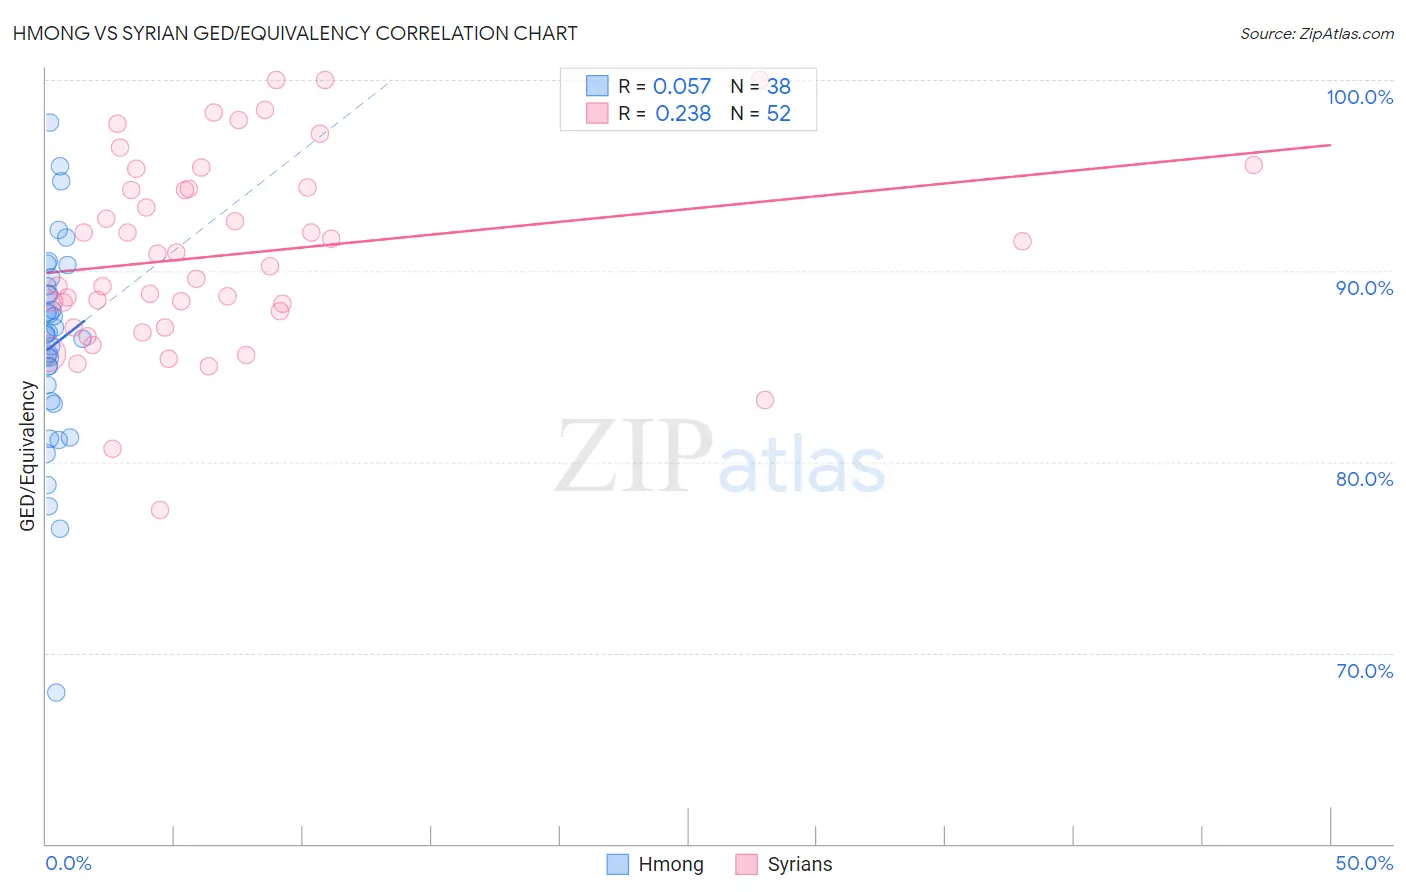
Hmong vs Syrian GED/Equivalency Correlation Chart
The statistical analysis conducted on geographies consisting of 24,672,093 people shows a slight positive correlation between the proportion of Hmong and percentage of population with at least ged/equivalency education in the United States with a correlation coefficient (R) of 0.057 and weighted average of 84.9%. Similarly, the statistical analysis conducted on geographies consisting of 266,306,452 people shows a weak positive correlation between the proportion of Syrians and percentage of population with at least ged/equivalency education in the United States with a correlation coefficient (R) of 0.238 and weighted average of 87.2%, a difference of 2.7%.
GED/Equivalency Correlation Summary
| Measurement | Hmong | Syrian |
| Minimum | 67.9% | 77.5% |
| Maximum | 97.8% | 100.0% |
| Range | 29.9% | 22.5% |
| Mean | 86.1% | 90.9% |
| Median | 86.7% | 90.6% |
| Interquartile 25% (IQ1) | 83.2% | 87.4% |
| Interquartile 75% (IQ3) | 89.2% | 94.3% |
| Interquartile Range (IQR) | 6.0% | 6.9% |
| Standard Deviation (Sample) | 5.6% | 5.0% |
| Standard Deviation (Population) | 5.5% | 5.0% |
Similar Demographics by GED/Equivalency
Demographics Similar to Hmong by GED/Equivalency
In terms of ged/equivalency, the demographic groups most similar to Hmong are Samoan (84.9%, a difference of 0.020%), Marshallese (84.9%, a difference of 0.030%), Colombian (84.9%, a difference of 0.040%), Immigrants from Cameroon (84.9%, a difference of 0.050%), and Liberian (85.0%, a difference of 0.060%).
| Demographics | Rating | Rank | GED/Equivalency |
| Uruguayans | 16.0 /100 | #200 | Poor 85.0% |
| Portuguese | 15.9 /100 | #201 | Poor 85.0% |
| Cree | 15.9 /100 | #202 | Poor 85.0% |
| Panamanians | 15.3 /100 | #203 | Poor 85.0% |
| Hawaiians | 15.2 /100 | #204 | Poor 85.0% |
| Liberians | 14.6 /100 | #205 | Poor 85.0% |
| Samoans | 13.7 /100 | #206 | Poor 84.9% |
| Hmong | 13.1 /100 | #207 | Poor 84.9% |
| Marshallese | 12.5 /100 | #208 | Poor 84.9% |
| Colombians | 12.3 /100 | #209 | Poor 84.9% |
| Immigrants | Cameroon | 12.1 /100 | #210 | Poor 84.9% |
| South Americans | 10.9 /100 | #211 | Poor 84.8% |
| Immigrants | Somalia | 10.6 /100 | #212 | Poor 84.8% |
| Immigrants | Philippines | 10.0 /100 | #213 | Poor 84.8% |
| Osage | 9.5 /100 | #214 | Tragic 84.8% |
Demographics Similar to Syrians by GED/Equivalency
In terms of ged/equivalency, the demographic groups most similar to Syrians are Palestinian (87.3%, a difference of 0.030%), Immigrants from Belarus (87.3%, a difference of 0.050%), Immigrants from Croatia (87.3%, a difference of 0.060%), Lebanese (87.2%, a difference of 0.060%), and Jordanian (87.2%, a difference of 0.070%).
| Demographics | Rating | Rank | GED/Equivalency |
| Immigrants | Russia | 97.8 /100 | #94 | Exceptional 87.4% |
| Immigrants | Greece | 97.7 /100 | #95 | Exceptional 87.4% |
| Czechoslovakians | 97.6 /100 | #96 | Exceptional 87.4% |
| Immigrants | Western Europe | 97.3 /100 | #97 | Exceptional 87.3% |
| Immigrants | Croatia | 96.9 /100 | #98 | Exceptional 87.3% |
| Immigrants | Belarus | 96.9 /100 | #99 | Exceptional 87.3% |
| Palestinians | 96.8 /100 | #100 | Exceptional 87.3% |
| Syrians | 96.6 /100 | #101 | Exceptional 87.2% |
| Lebanese | 96.2 /100 | #102 | Exceptional 87.2% |
| Jordanians | 96.1 /100 | #103 | Exceptional 87.2% |
| Immigrants | Hungary | 96.0 /100 | #104 | Exceptional 87.2% |
| Indians (Asian) | 95.9 /100 | #105 | Exceptional 87.1% |
| Immigrants | Zimbabwe | 95.8 /100 | #106 | Exceptional 87.1% |
| Icelanders | 95.7 /100 | #107 | Exceptional 87.1% |
| Canadians | 95.6 /100 | #108 | Exceptional 87.1% |