Ute vs Panamanian GED/Equivalency
COMPARE
Ute
Panamanian
GED/Equivalency
GED/Equivalency Comparison
Ute
Panamanians
81.8%
GED/EQUIVALENCY
0.0/ 100
METRIC RATING
298th/ 347
METRIC RANK
85.0%
GED/EQUIVALENCY
15.3/ 100
METRIC RATING
203rd/ 347
METRIC RANK
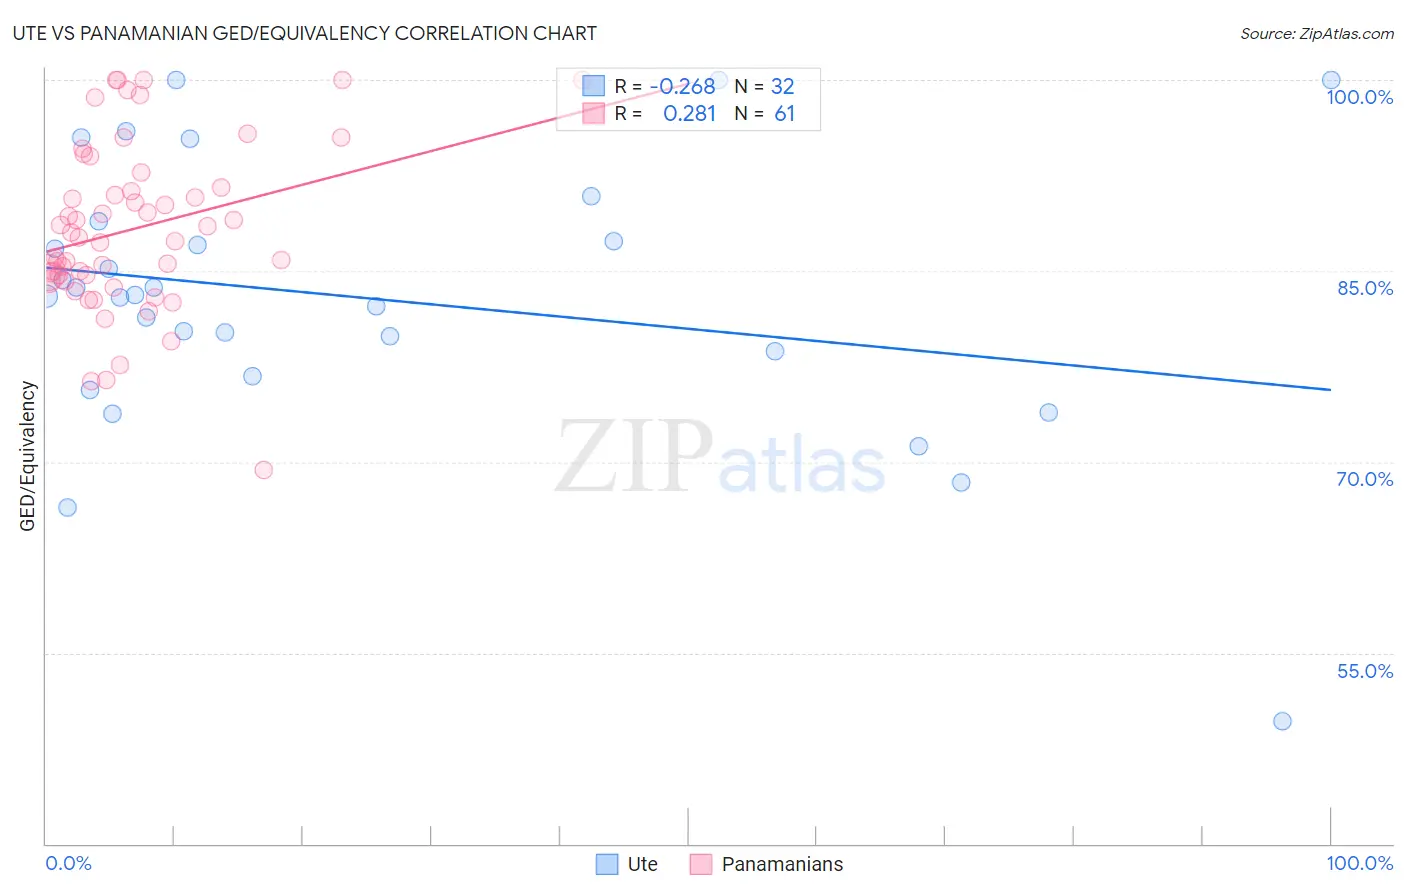
Ute vs Panamanian GED/Equivalency Correlation Chart
The statistical analysis conducted on geographies consisting of 55,668,599 people shows a weak negative correlation between the proportion of Ute and percentage of population with at least ged/equivalency education in the United States with a correlation coefficient (R) of -0.268 and weighted average of 81.8%. Similarly, the statistical analysis conducted on geographies consisting of 281,248,812 people shows a weak positive correlation between the proportion of Panamanians and percentage of population with at least ged/equivalency education in the United States with a correlation coefficient (R) of 0.281 and weighted average of 85.0%, a difference of 3.9%.
GED/Equivalency Correlation Summary
| Measurement | Ute | Panamanian |
| Minimum | 49.6% | 69.4% |
| Maximum | 100.0% | 100.0% |
| Range | 50.4% | 30.6% |
| Mean | 82.9% | 88.3% |
| Median | 83.0% | 87.6% |
| Interquartile 25% (IQ1) | 77.7% | 84.4% |
| Interquartile 75% (IQ3) | 88.1% | 92.2% |
| Interquartile Range (IQR) | 10.4% | 7.7% |
| Standard Deviation (Sample) | 10.7% | 6.6% |
| Standard Deviation (Population) | 10.5% | 6.5% |
Similar Demographics by GED/Equivalency
Demographics Similar to Ute by GED/Equivalency
In terms of ged/equivalency, the demographic groups most similar to Ute are Immigrants from Bangladesh (81.9%, a difference of 0.090%), Vietnamese (81.9%, a difference of 0.14%), Ecuadorian (81.7%, a difference of 0.14%), Nepalese (81.9%, a difference of 0.17%), and Fijian (81.6%, a difference of 0.20%).
| Demographics | Rating | Rank | GED/Equivalency |
| Cubans | 0.0 /100 | #291 | Tragic 82.0% |
| Paiute | 0.0 /100 | #292 | Tragic 82.0% |
| British West Indians | 0.0 /100 | #293 | Tragic 82.0% |
| Immigrants | St. Vincent and the Grenadines | 0.0 /100 | #294 | Tragic 82.0% |
| Nepalese | 0.0 /100 | #295 | Tragic 81.9% |
| Vietnamese | 0.0 /100 | #296 | Tragic 81.9% |
| Immigrants | Bangladesh | 0.0 /100 | #297 | Tragic 81.9% |
| Ute | 0.0 /100 | #298 | Tragic 81.8% |
| Ecuadorians | 0.0 /100 | #299 | Tragic 81.7% |
| Fijians | 0.0 /100 | #300 | Tragic 81.6% |
| Dutch West Indians | 0.0 /100 | #301 | Tragic 81.6% |
| Immigrants | Haiti | 0.0 /100 | #302 | Tragic 81.6% |
| Immigrants | Portugal | 0.0 /100 | #303 | Tragic 81.6% |
| Navajo | 0.0 /100 | #304 | Tragic 81.5% |
| Immigrants | Grenada | 0.0 /100 | #305 | Tragic 81.3% |
Demographics Similar to Panamanians by GED/Equivalency
In terms of ged/equivalency, the demographic groups most similar to Panamanians are Hawaiian (85.0%, a difference of 0.0%), Portuguese (85.0%, a difference of 0.020%), Cree (85.0%, a difference of 0.020%), Uruguayan (85.0%, a difference of 0.030%), and Liberian (85.0%, a difference of 0.030%).
| Demographics | Rating | Rank | GED/Equivalency |
| Tongans | 20.7 /100 | #196 | Fair 85.2% |
| Costa Ricans | 20.4 /100 | #197 | Fair 85.2% |
| Immigrants | Africa | 17.5 /100 | #198 | Poor 85.1% |
| Somalis | 16.4 /100 | #199 | Poor 85.0% |
| Uruguayans | 16.0 /100 | #200 | Poor 85.0% |
| Portuguese | 15.9 /100 | #201 | Poor 85.0% |
| Cree | 15.9 /100 | #202 | Poor 85.0% |
| Panamanians | 15.3 /100 | #203 | Poor 85.0% |
| Hawaiians | 15.2 /100 | #204 | Poor 85.0% |
| Liberians | 14.6 /100 | #205 | Poor 85.0% |
| Samoans | 13.7 /100 | #206 | Poor 84.9% |
| Hmong | 13.1 /100 | #207 | Poor 84.9% |
| Marshallese | 12.5 /100 | #208 | Poor 84.9% |
| Colombians | 12.3 /100 | #209 | Poor 84.9% |
| Immigrants | Cameroon | 12.1 /100 | #210 | Poor 84.9% |