Iranian vs Panamanian GED/Equivalency
COMPARE
Iranian
Panamanian
GED/Equivalency
GED/Equivalency Comparison
Iranians
Panamanians
89.2%
GED/EQUIVALENCY
100.0/ 100
METRIC RATING
4th/ 347
METRIC RANK
85.0%
GED/EQUIVALENCY
15.3/ 100
METRIC RATING
203rd/ 347
METRIC RANK
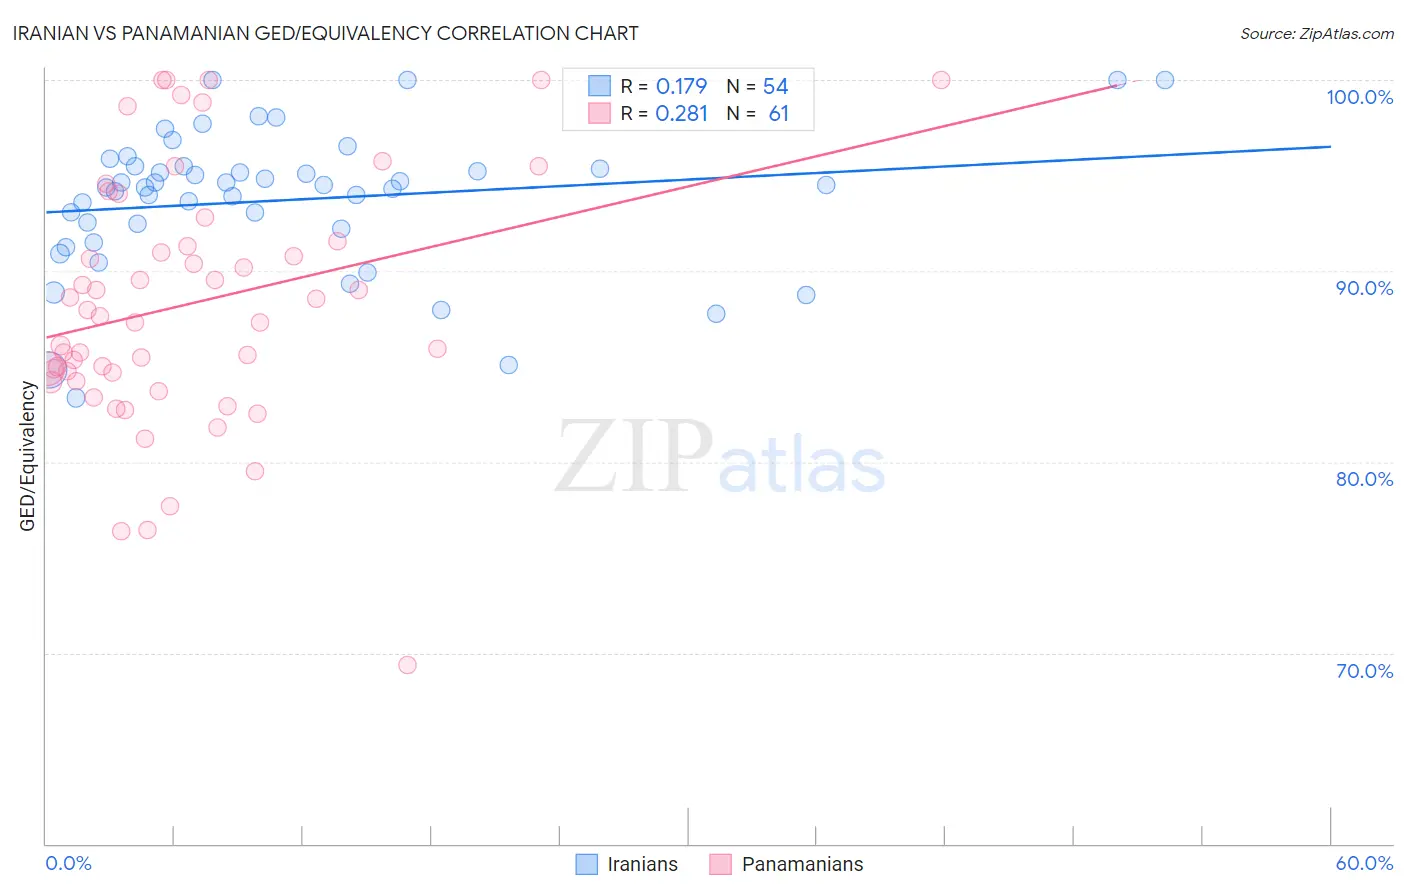
Iranian vs Panamanian GED/Equivalency Correlation Chart
The statistical analysis conducted on geographies consisting of 316,902,917 people shows a poor positive correlation between the proportion of Iranians and percentage of population with at least ged/equivalency education in the United States with a correlation coefficient (R) of 0.179 and weighted average of 89.2%. Similarly, the statistical analysis conducted on geographies consisting of 281,248,812 people shows a weak positive correlation between the proportion of Panamanians and percentage of population with at least ged/equivalency education in the United States with a correlation coefficient (R) of 0.281 and weighted average of 85.0%, a difference of 5.0%.
GED/Equivalency Correlation Summary
| Measurement | Iranian | Panamanian |
| Minimum | 83.3% | 69.4% |
| Maximum | 100.0% | 100.0% |
| Range | 16.7% | 30.6% |
| Mean | 93.7% | 88.3% |
| Median | 94.5% | 87.6% |
| Interquartile 25% (IQ1) | 92.2% | 84.4% |
| Interquartile 75% (IQ3) | 95.5% | 92.2% |
| Interquartile Range (IQR) | 3.3% | 7.7% |
| Standard Deviation (Sample) | 3.7% | 6.6% |
| Standard Deviation (Population) | 3.7% | 6.5% |
Similar Demographics by GED/Equivalency
Demographics Similar to Iranians by GED/Equivalency
In terms of ged/equivalency, the demographic groups most similar to Iranians are Immigrants from Singapore (89.3%, a difference of 0.090%), Latvian (89.2%, a difference of 0.10%), Thai (89.1%, a difference of 0.12%), Eastern European (89.1%, a difference of 0.16%), and Carpatho Rusyn (89.1%, a difference of 0.21%).
| Demographics | Rating | Rank | GED/Equivalency |
| Immigrants | India | 100.0 /100 | #1 | Exceptional 89.7% |
| Filipinos | 100.0 /100 | #2 | Exceptional 89.5% |
| Immigrants | Singapore | 100.0 /100 | #3 | Exceptional 89.3% |
| Iranians | 100.0 /100 | #4 | Exceptional 89.2% |
| Latvians | 100.0 /100 | #5 | Exceptional 89.2% |
| Thais | 100.0 /100 | #6 | Exceptional 89.1% |
| Eastern Europeans | 99.9 /100 | #7 | Exceptional 89.1% |
| Carpatho Rusyns | 99.9 /100 | #8 | Exceptional 89.1% |
| Chinese | 99.9 /100 | #9 | Exceptional 89.0% |
| Norwegians | 99.9 /100 | #10 | Exceptional 89.0% |
| Bulgarians | 99.9 /100 | #11 | Exceptional 89.0% |
| Lithuanians | 99.9 /100 | #12 | Exceptional 88.9% |
| Immigrants | Iran | 99.9 /100 | #13 | Exceptional 88.9% |
| Cypriots | 99.9 /100 | #14 | Exceptional 88.9% |
| Okinawans | 99.9 /100 | #15 | Exceptional 88.9% |
Demographics Similar to Panamanians by GED/Equivalency
In terms of ged/equivalency, the demographic groups most similar to Panamanians are Hawaiian (85.0%, a difference of 0.0%), Portuguese (85.0%, a difference of 0.020%), Cree (85.0%, a difference of 0.020%), Uruguayan (85.0%, a difference of 0.030%), and Liberian (85.0%, a difference of 0.030%).
| Demographics | Rating | Rank | GED/Equivalency |
| Tongans | 20.7 /100 | #196 | Fair 85.2% |
| Costa Ricans | 20.4 /100 | #197 | Fair 85.2% |
| Immigrants | Africa | 17.5 /100 | #198 | Poor 85.1% |
| Somalis | 16.4 /100 | #199 | Poor 85.0% |
| Uruguayans | 16.0 /100 | #200 | Poor 85.0% |
| Portuguese | 15.9 /100 | #201 | Poor 85.0% |
| Cree | 15.9 /100 | #202 | Poor 85.0% |
| Panamanians | 15.3 /100 | #203 | Poor 85.0% |
| Hawaiians | 15.2 /100 | #204 | Poor 85.0% |
| Liberians | 14.6 /100 | #205 | Poor 85.0% |
| Samoans | 13.7 /100 | #206 | Poor 84.9% |
| Hmong | 13.1 /100 | #207 | Poor 84.9% |
| Marshallese | 12.5 /100 | #208 | Poor 84.9% |
| Colombians | 12.3 /100 | #209 | Poor 84.9% |
| Immigrants | Cameroon | 12.1 /100 | #210 | Poor 84.9% |