Maltese vs Panamanian GED/Equivalency
COMPARE
Maltese
Panamanian
GED/Equivalency
GED/Equivalency Comparison
Maltese
Panamanians
88.6%
GED/EQUIVALENCY
99.9/ 100
METRIC RATING
20th/ 347
METRIC RANK
85.0%
GED/EQUIVALENCY
15.3/ 100
METRIC RATING
203rd/ 347
METRIC RANK
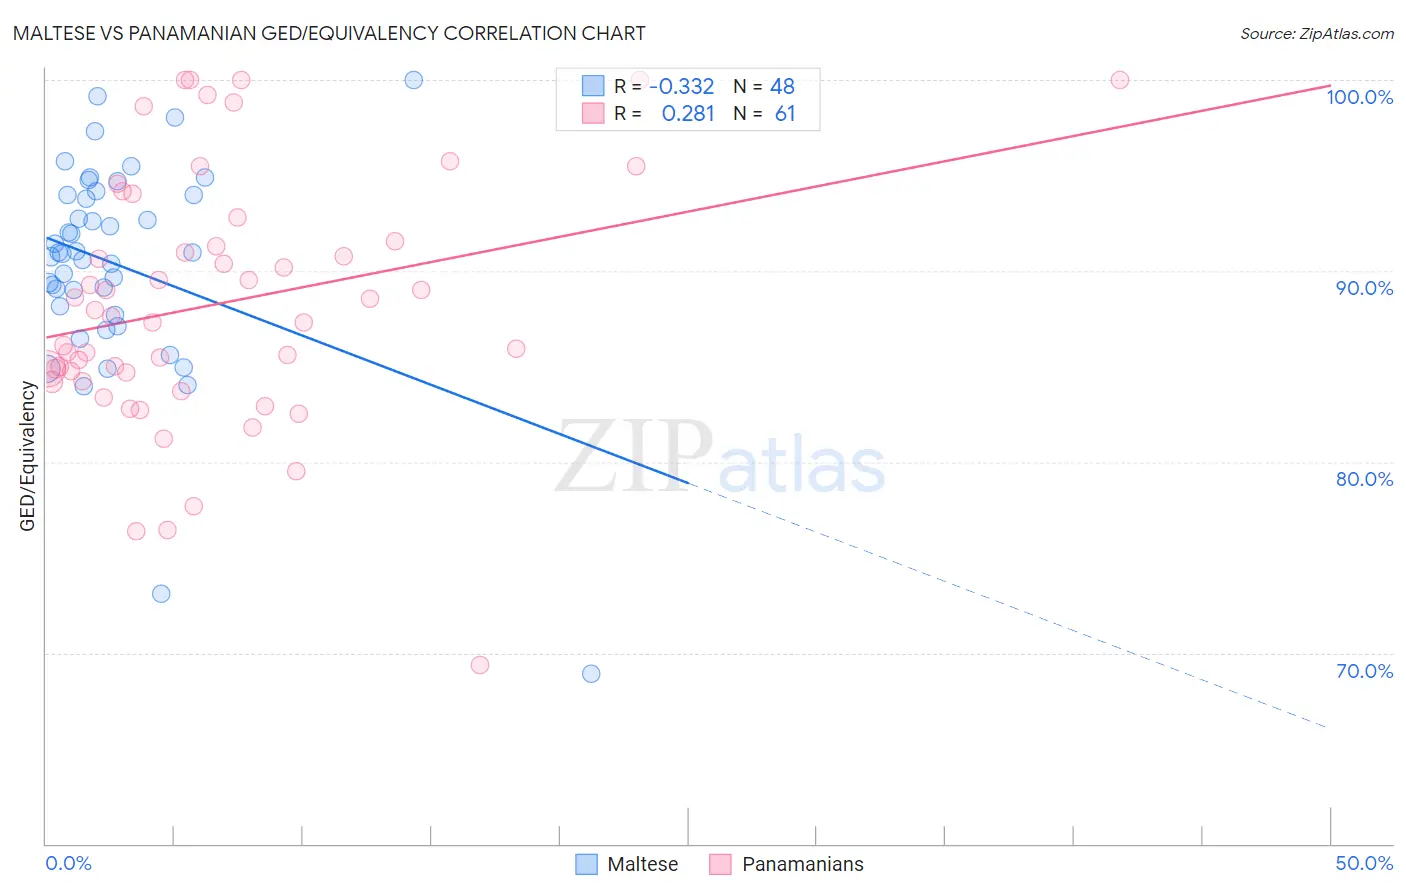
Maltese vs Panamanian GED/Equivalency Correlation Chart
The statistical analysis conducted on geographies consisting of 126,478,070 people shows a mild negative correlation between the proportion of Maltese and percentage of population with at least ged/equivalency education in the United States with a correlation coefficient (R) of -0.332 and weighted average of 88.6%. Similarly, the statistical analysis conducted on geographies consisting of 281,248,812 people shows a weak positive correlation between the proportion of Panamanians and percentage of population with at least ged/equivalency education in the United States with a correlation coefficient (R) of 0.281 and weighted average of 85.0%, a difference of 4.3%.
GED/Equivalency Correlation Summary
| Measurement | Maltese | Panamanian |
| Minimum | 68.9% | 69.4% |
| Maximum | 100.0% | 100.0% |
| Range | 31.1% | 30.6% |
| Mean | 90.3% | 88.3% |
| Median | 90.9% | 87.6% |
| Interquartile 25% (IQ1) | 87.9% | 84.4% |
| Interquartile 75% (IQ3) | 94.0% | 92.2% |
| Interquartile Range (IQR) | 6.0% | 7.7% |
| Standard Deviation (Sample) | 5.7% | 6.6% |
| Standard Deviation (Population) | 5.6% | 6.5% |
Similar Demographics by GED/Equivalency
Demographics Similar to Maltese by GED/Equivalency
In terms of ged/equivalency, the demographic groups most similar to Maltese are Luxembourger (88.6%, a difference of 0.010%), Immigrants from Ireland (88.6%, a difference of 0.020%), Russian (88.6%, a difference of 0.040%), Slovak (88.6%, a difference of 0.040%), and Estonian (88.6%, a difference of 0.040%).
| Demographics | Rating | Rank | GED/Equivalency |
| Immigrants | Iran | 99.9 /100 | #13 | Exceptional 88.9% |
| Cypriots | 99.9 /100 | #14 | Exceptional 88.9% |
| Okinawans | 99.9 /100 | #15 | Exceptional 88.9% |
| Immigrants | Taiwan | 99.9 /100 | #16 | Exceptional 88.8% |
| Croatians | 99.9 /100 | #17 | Exceptional 88.8% |
| Slovenes | 99.9 /100 | #18 | Exceptional 88.8% |
| Swedes | 99.9 /100 | #19 | Exceptional 88.8% |
| Maltese | 99.9 /100 | #20 | Exceptional 88.6% |
| Luxembourgers | 99.8 /100 | #21 | Exceptional 88.6% |
| Immigrants | Ireland | 99.8 /100 | #22 | Exceptional 88.6% |
| Russians | 99.8 /100 | #23 | Exceptional 88.6% |
| Slovaks | 99.8 /100 | #24 | Exceptional 88.6% |
| Estonians | 99.8 /100 | #25 | Exceptional 88.6% |
| Immigrants | Australia | 99.8 /100 | #26 | Exceptional 88.6% |
| Immigrants | Lithuania | 99.8 /100 | #27 | Exceptional 88.6% |
Demographics Similar to Panamanians by GED/Equivalency
In terms of ged/equivalency, the demographic groups most similar to Panamanians are Hawaiian (85.0%, a difference of 0.0%), Portuguese (85.0%, a difference of 0.020%), Cree (85.0%, a difference of 0.020%), Uruguayan (85.0%, a difference of 0.030%), and Liberian (85.0%, a difference of 0.030%).
| Demographics | Rating | Rank | GED/Equivalency |
| Tongans | 20.7 /100 | #196 | Fair 85.2% |
| Costa Ricans | 20.4 /100 | #197 | Fair 85.2% |
| Immigrants | Africa | 17.5 /100 | #198 | Poor 85.1% |
| Somalis | 16.4 /100 | #199 | Poor 85.0% |
| Uruguayans | 16.0 /100 | #200 | Poor 85.0% |
| Portuguese | 15.9 /100 | #201 | Poor 85.0% |
| Cree | 15.9 /100 | #202 | Poor 85.0% |
| Panamanians | 15.3 /100 | #203 | Poor 85.0% |
| Hawaiians | 15.2 /100 | #204 | Poor 85.0% |
| Liberians | 14.6 /100 | #205 | Poor 85.0% |
| Samoans | 13.7 /100 | #206 | Poor 84.9% |
| Hmong | 13.1 /100 | #207 | Poor 84.9% |
| Marshallese | 12.5 /100 | #208 | Poor 84.9% |
| Colombians | 12.3 /100 | #209 | Poor 84.9% |
| Immigrants | Cameroon | 12.1 /100 | #210 | Poor 84.9% |