Immigrants from Scotland vs Immigrants from England Associate's Degree
COMPARE
Immigrants from Scotland
Immigrants from England
Associate's Degree
Associate's Degree Comparison
Immigrants from Scotland
Immigrants from England
50.6%
ASSOCIATE'S DEGREE
99.3/ 100
METRIC RATING
75th/ 347
METRIC RANK
49.7%
ASSOCIATE'S DEGREE
98.0/ 100
METRIC RATING
95th/ 347
METRIC RANK
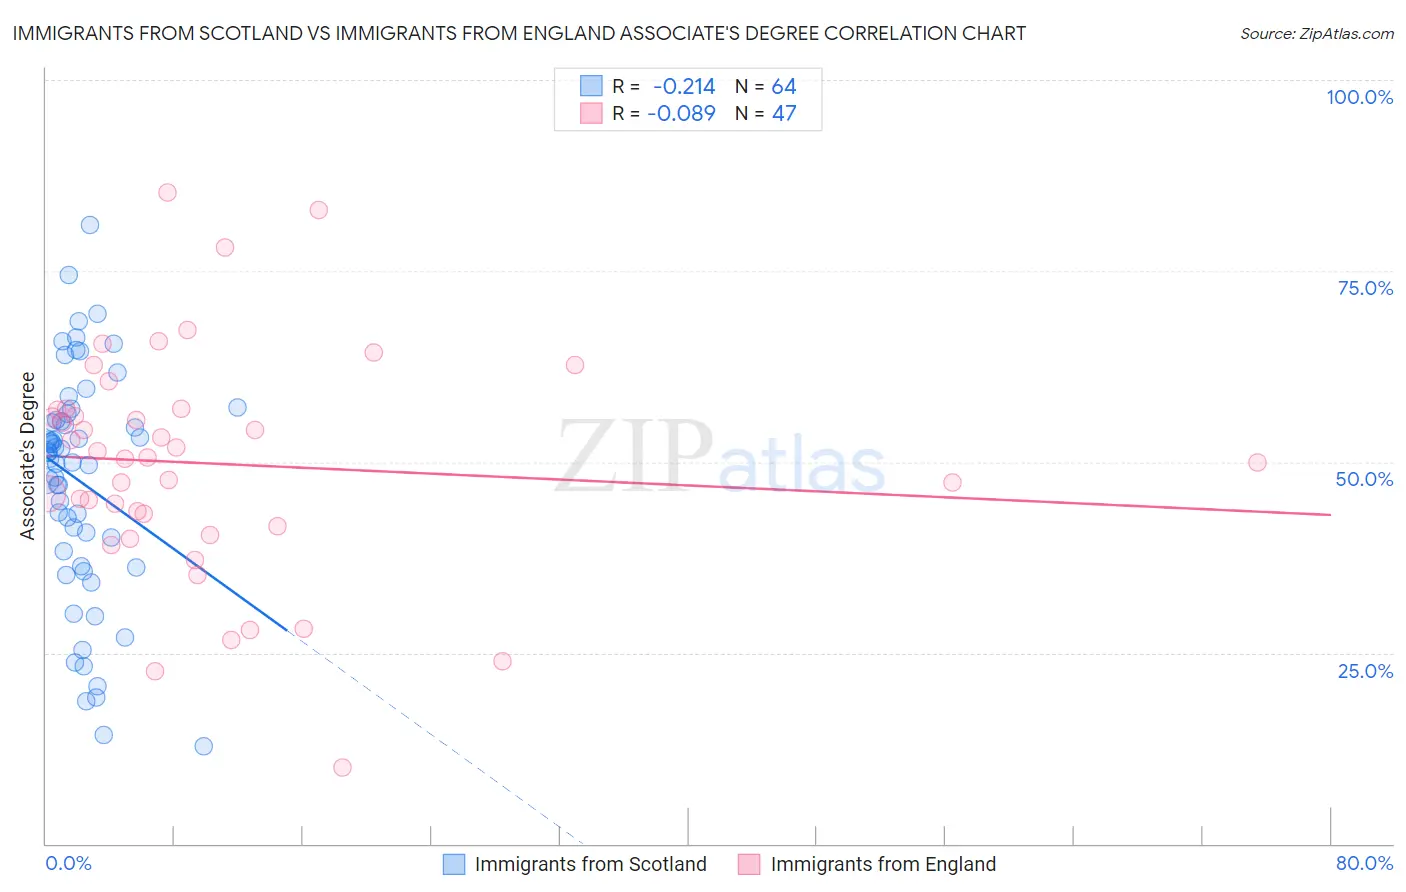
Immigrants from Scotland vs Immigrants from England Associate's Degree Correlation Chart
The statistical analysis conducted on geographies consisting of 196,397,243 people shows a weak negative correlation between the proportion of Immigrants from Scotland and percentage of population with at least associate's degree education in the United States with a correlation coefficient (R) of -0.214 and weighted average of 50.6%. Similarly, the statistical analysis conducted on geographies consisting of 391,885,412 people shows a slight negative correlation between the proportion of Immigrants from England and percentage of population with at least associate's degree education in the United States with a correlation coefficient (R) of -0.089 and weighted average of 49.7%, a difference of 1.7%.
Associate's Degree Correlation Summary
| Measurement | Immigrants from Scotland | Immigrants from England |
| Minimum | 12.7% | 10.0% |
| Maximum | 81.0% | 85.3% |
| Range | 68.2% | 75.3% |
| Mean | 47.4% | 49.8% |
| Median | 50.9% | 50.6% |
| Interquartile 25% (IQ1) | 37.3% | 41.6% |
| Interquartile 75% (IQ3) | 55.9% | 56.9% |
| Interquartile Range (IQR) | 18.6% | 15.3% |
| Standard Deviation (Sample) | 15.1% | 15.0% |
| Standard Deviation (Population) | 14.9% | 14.9% |
Demographics Similar to Immigrants from Scotland and Immigrants from England by Associate's Degree
In terms of associate's degree, the demographic groups most similar to Immigrants from Scotland are Immigrants from Zimbabwe (50.5%, a difference of 0.21%), Immigrants from Lebanon (50.5%, a difference of 0.24%), Immigrants from Eastern Europe (50.5%, a difference of 0.29%), Ethiopian (50.4%, a difference of 0.30%), and Armenian (50.4%, a difference of 0.33%). Similarly, the demographic groups most similar to Immigrants from England are Laotian (49.9%, a difference of 0.39%), Immigrants from Brazil (50.0%, a difference of 0.52%), Immigrants from North America (50.1%, a difference of 0.68%), Immigrants from Western Asia (50.1%, a difference of 0.70%), and Immigrants from Western Europe (50.1%, a difference of 0.78%).
| Demographics | Rating | Rank | Associate's Degree |
| Immigrants | Scotland | 99.3 /100 | #75 | Exceptional 50.6% |
| Immigrants | Zimbabwe | 99.2 /100 | #76 | Exceptional 50.5% |
| Immigrants | Lebanon | 99.1 /100 | #77 | Exceptional 50.5% |
| Immigrants | Eastern Europe | 99.1 /100 | #78 | Exceptional 50.5% |
| Ethiopians | 99.1 /100 | #79 | Exceptional 50.4% |
| Armenians | 99.1 /100 | #80 | Exceptional 50.4% |
| Maltese | 99.1 /100 | #81 | Exceptional 50.4% |
| Greeks | 98.9 /100 | #82 | Exceptional 50.3% |
| Immigrants | Uzbekistan | 98.9 /100 | #83 | Exceptional 50.3% |
| Immigrants | Hungary | 98.9 /100 | #84 | Exceptional 50.2% |
| Immigrants | Egypt | 98.9 /100 | #85 | Exceptional 50.2% |
| Immigrants | Croatia | 98.9 /100 | #86 | Exceptional 50.2% |
| Immigrants | Moldova | 98.8 /100 | #87 | Exceptional 50.2% |
| Immigrants | Canada | 98.7 /100 | #88 | Exceptional 50.1% |
| Immigrants | Western Europe | 98.7 /100 | #89 | Exceptional 50.1% |
| Immigrants | Ethiopia | 98.7 /100 | #90 | Exceptional 50.1% |
| Immigrants | Western Asia | 98.7 /100 | #91 | Exceptional 50.1% |
| Immigrants | North America | 98.7 /100 | #92 | Exceptional 50.1% |
| Immigrants | Brazil | 98.5 /100 | #93 | Exceptional 50.0% |
| Laotians | 98.4 /100 | #94 | Exceptional 49.9% |
| Immigrants | England | 98.0 /100 | #95 | Exceptional 49.7% |