Ghanaian vs Immigrants from England Associate's Degree
COMPARE
Ghanaian
Immigrants from England
Associate's Degree
Associate's Degree Comparison
Ghanaians
Immigrants from England
45.8%
ASSOCIATE'S DEGREE
35.5/ 100
METRIC RATING
188th/ 347
METRIC RANK
49.7%
ASSOCIATE'S DEGREE
98.0/ 100
METRIC RATING
95th/ 347
METRIC RANK
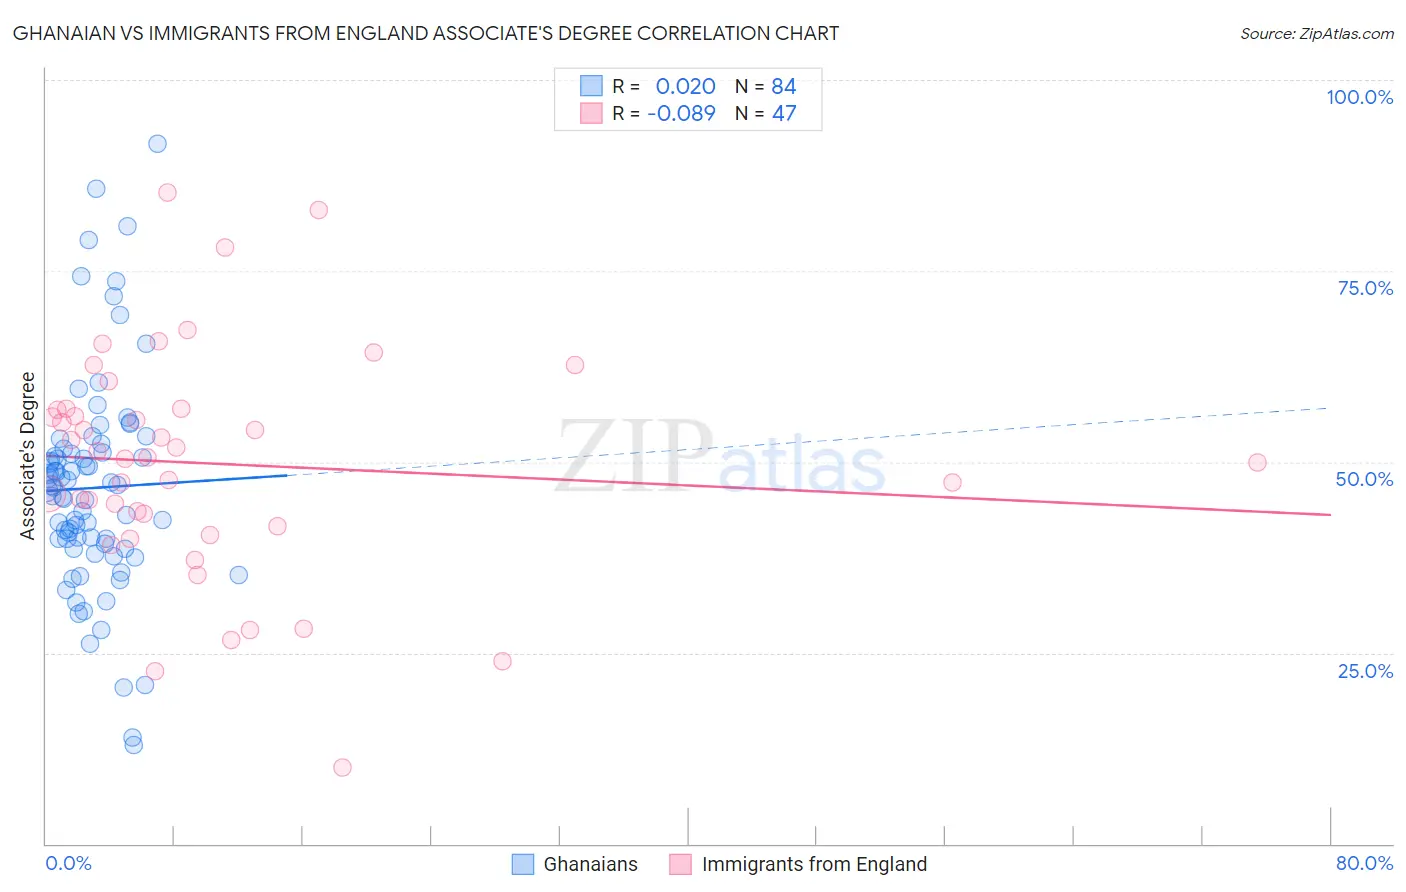
Ghanaian vs Immigrants from England Associate's Degree Correlation Chart
The statistical analysis conducted on geographies consisting of 190,686,281 people shows no correlation between the proportion of Ghanaians and percentage of population with at least associate's degree education in the United States with a correlation coefficient (R) of 0.020 and weighted average of 45.8%. Similarly, the statistical analysis conducted on geographies consisting of 391,885,412 people shows a slight negative correlation between the proportion of Immigrants from England and percentage of population with at least associate's degree education in the United States with a correlation coefficient (R) of -0.089 and weighted average of 49.7%, a difference of 8.5%.
Associate's Degree Correlation Summary
| Measurement | Ghanaian | Immigrants from England |
| Minimum | 13.0% | 10.0% |
| Maximum | 91.7% | 85.3% |
| Range | 78.7% | 75.3% |
| Mean | 46.6% | 49.8% |
| Median | 46.4% | 50.6% |
| Interquartile 25% (IQ1) | 38.9% | 41.6% |
| Interquartile 75% (IQ3) | 51.4% | 56.9% |
| Interquartile Range (IQR) | 12.5% | 15.3% |
| Standard Deviation (Sample) | 14.3% | 15.0% |
| Standard Deviation (Population) | 14.2% | 14.9% |
Similar Demographics by Associate's Degree
Demographics Similar to Ghanaians by Associate's Degree
In terms of associate's degree, the demographic groups most similar to Ghanaians are Immigrants from Uruguay (45.8%, a difference of 0.0%), Immigrants from Oceania (45.8%, a difference of 0.060%), Vietnamese (45.8%, a difference of 0.12%), Korean (45.8%, a difference of 0.13%), and Celtic (45.8%, a difference of 0.18%).
| Demographics | Rating | Rank | Associate's Degree |
| Immigrants | Colombia | 41.3 /100 | #181 | Average 46.0% |
| Swiss | 40.4 /100 | #182 | Average 46.0% |
| Yugoslavians | 40.2 /100 | #183 | Average 46.0% |
| Czechoslovakians | 40.0 /100 | #184 | Average 46.0% |
| Costa Ricans | 38.6 /100 | #185 | Fair 46.0% |
| Welsh | 37.9 /100 | #186 | Fair 45.9% |
| Immigrants | Uruguay | 35.5 /100 | #187 | Fair 45.8% |
| Ghanaians | 35.5 /100 | #188 | Fair 45.8% |
| Immigrants | Oceania | 34.7 /100 | #189 | Fair 45.8% |
| Vietnamese | 34.0 /100 | #190 | Fair 45.8% |
| Koreans | 33.8 /100 | #191 | Fair 45.8% |
| Celtics | 33.3 /100 | #192 | Fair 45.8% |
| Immigrants | Cameroon | 31.0 /100 | #193 | Fair 45.7% |
| Immigrants | Peru | 27.6 /100 | #194 | Fair 45.5% |
| Germans | 26.5 /100 | #195 | Fair 45.5% |
Demographics Similar to Immigrants from England by Associate's Degree
In terms of associate's degree, the demographic groups most similar to Immigrants from England are Romanian (49.7%, a difference of 0.010%), Immigrants from Ukraine (49.7%, a difference of 0.020%), Immigrants from Northern Africa (49.7%, a difference of 0.11%), Macedonian (49.6%, a difference of 0.18%), and Laotian (49.9%, a difference of 0.39%).
| Demographics | Rating | Rank | Associate's Degree |
| Immigrants | Canada | 98.7 /100 | #88 | Exceptional 50.1% |
| Immigrants | Western Europe | 98.7 /100 | #89 | Exceptional 50.1% |
| Immigrants | Ethiopia | 98.7 /100 | #90 | Exceptional 50.1% |
| Immigrants | Western Asia | 98.7 /100 | #91 | Exceptional 50.1% |
| Immigrants | North America | 98.7 /100 | #92 | Exceptional 50.1% |
| Immigrants | Brazil | 98.5 /100 | #93 | Exceptional 50.0% |
| Laotians | 98.4 /100 | #94 | Exceptional 49.9% |
| Immigrants | England | 98.0 /100 | #95 | Exceptional 49.7% |
| Romanians | 98.0 /100 | #96 | Exceptional 49.7% |
| Immigrants | Ukraine | 98.0 /100 | #97 | Exceptional 49.7% |
| Immigrants | Northern Africa | 97.9 /100 | #98 | Exceptional 49.7% |
| Macedonians | 97.8 /100 | #99 | Exceptional 49.6% |
| Immigrants | Nepal | 97.5 /100 | #100 | Exceptional 49.5% |
| Northern Europeans | 97.3 /100 | #101 | Exceptional 49.5% |
| Chileans | 97.3 /100 | #102 | Exceptional 49.4% |