Sudanese vs Immigrants from England Associate's Degree
COMPARE
Sudanese
Immigrants from England
Associate's Degree
Associate's Degree Comparison
Sudanese
Immigrants from England
47.1%
ASSOCIATE'S DEGREE
70.3/ 100
METRIC RATING
157th/ 347
METRIC RANK
49.7%
ASSOCIATE'S DEGREE
98.0/ 100
METRIC RATING
95th/ 347
METRIC RANK
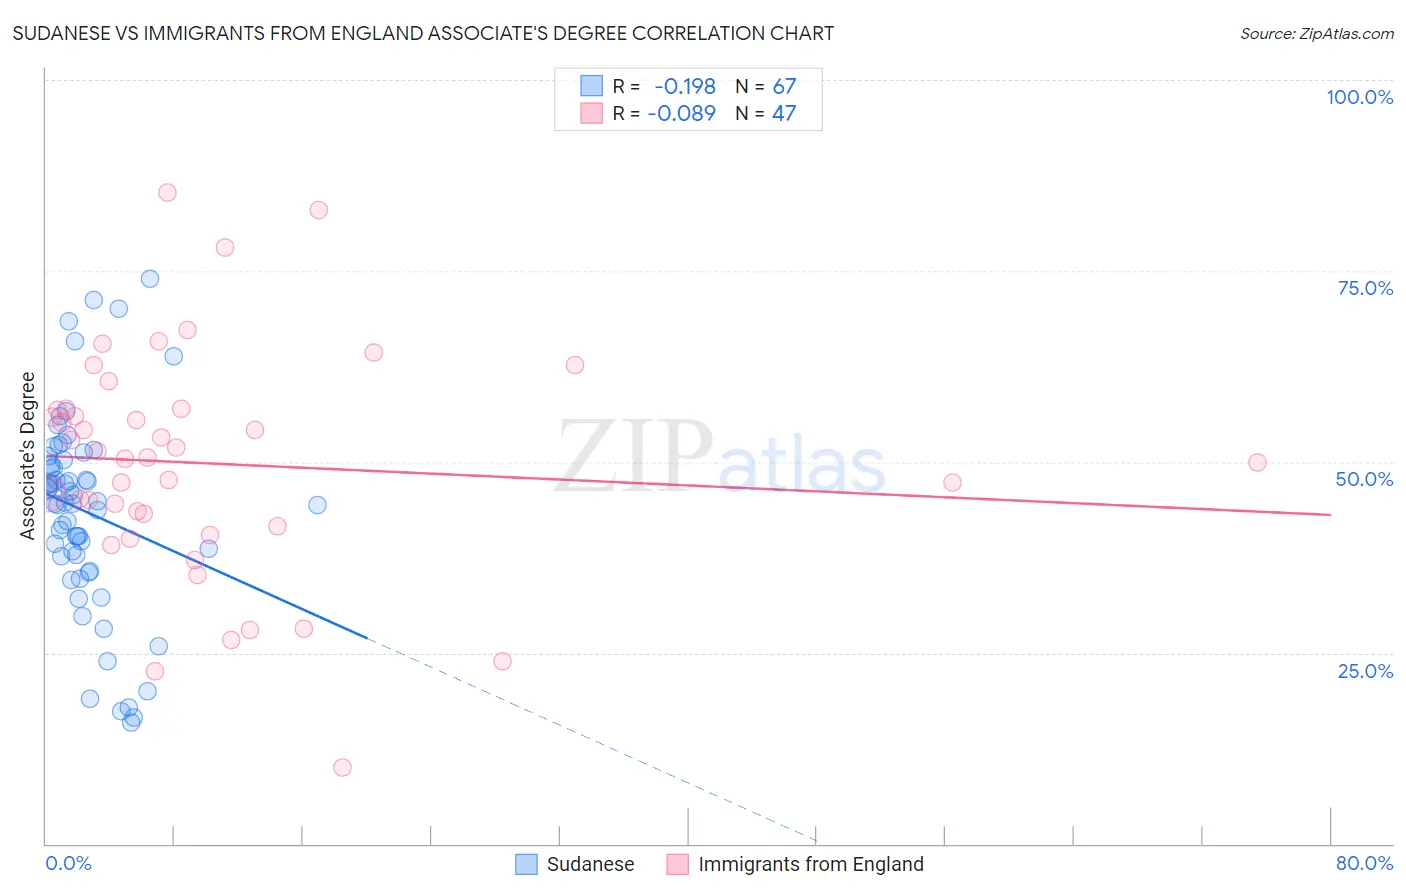
Sudanese vs Immigrants from England Associate's Degree Correlation Chart
The statistical analysis conducted on geographies consisting of 110,144,981 people shows a poor negative correlation between the proportion of Sudanese and percentage of population with at least associate's degree education in the United States with a correlation coefficient (R) of -0.198 and weighted average of 47.1%. Similarly, the statistical analysis conducted on geographies consisting of 391,885,412 people shows a slight negative correlation between the proportion of Immigrants from England and percentage of population with at least associate's degree education in the United States with a correlation coefficient (R) of -0.089 and weighted average of 49.7%, a difference of 5.6%.
Associate's Degree Correlation Summary
| Measurement | Sudanese | Immigrants from England |
| Minimum | 15.8% | 10.0% |
| Maximum | 74.0% | 85.3% |
| Range | 58.2% | 75.3% |
| Mean | 43.5% | 49.8% |
| Median | 44.6% | 50.6% |
| Interquartile 25% (IQ1) | 37.6% | 41.6% |
| Interquartile 75% (IQ3) | 50.2% | 56.9% |
| Interquartile Range (IQR) | 12.6% | 15.3% |
| Standard Deviation (Sample) | 12.9% | 15.0% |
| Standard Deviation (Population) | 12.8% | 14.9% |
Similar Demographics by Associate's Degree
Demographics Similar to Sudanese by Associate's Degree
In terms of associate's degree, the demographic groups most similar to Sudanese are South American (47.1%, a difference of 0.020%), Kenyan (47.1%, a difference of 0.030%), Immigrants from Germany (47.1%, a difference of 0.040%), Immigrants from Poland (47.1%, a difference of 0.090%), and Immigrants from Kenya (47.2%, a difference of 0.16%).
| Demographics | Rating | Rank | Associate's Degree |
| Iraqis | 76.2 /100 | #150 | Good 47.4% |
| Immigrants | North Macedonia | 76.0 /100 | #151 | Good 47.4% |
| Immigrants | Afghanistan | 74.3 /100 | #152 | Good 47.3% |
| Czechs | 72.2 /100 | #153 | Good 47.2% |
| Immigrants | Kenya | 72.1 /100 | #154 | Good 47.2% |
| Kenyans | 70.6 /100 | #155 | Good 47.1% |
| South Americans | 70.5 /100 | #156 | Good 47.1% |
| Sudanese | 70.3 /100 | #157 | Good 47.1% |
| Immigrants | Germany | 69.7 /100 | #158 | Good 47.1% |
| Immigrants | Poland | 69.2 /100 | #159 | Good 47.1% |
| Scottish | 65.4 /100 | #160 | Good 46.9% |
| Scandinavians | 65.2 /100 | #161 | Good 46.9% |
| Immigrants | Africa | 63.2 /100 | #162 | Good 46.8% |
| Somalis | 62.5 /100 | #163 | Good 46.8% |
| Colombians | 62.4 /100 | #164 | Good 46.8% |
Demographics Similar to Immigrants from England by Associate's Degree
In terms of associate's degree, the demographic groups most similar to Immigrants from England are Romanian (49.7%, a difference of 0.010%), Immigrants from Ukraine (49.7%, a difference of 0.020%), Immigrants from Northern Africa (49.7%, a difference of 0.11%), Macedonian (49.6%, a difference of 0.18%), and Laotian (49.9%, a difference of 0.39%).
| Demographics | Rating | Rank | Associate's Degree |
| Immigrants | Canada | 98.7 /100 | #88 | Exceptional 50.1% |
| Immigrants | Western Europe | 98.7 /100 | #89 | Exceptional 50.1% |
| Immigrants | Ethiopia | 98.7 /100 | #90 | Exceptional 50.1% |
| Immigrants | Western Asia | 98.7 /100 | #91 | Exceptional 50.1% |
| Immigrants | North America | 98.7 /100 | #92 | Exceptional 50.1% |
| Immigrants | Brazil | 98.5 /100 | #93 | Exceptional 50.0% |
| Laotians | 98.4 /100 | #94 | Exceptional 49.9% |
| Immigrants | England | 98.0 /100 | #95 | Exceptional 49.7% |
| Romanians | 98.0 /100 | #96 | Exceptional 49.7% |
| Immigrants | Ukraine | 98.0 /100 | #97 | Exceptional 49.7% |
| Immigrants | Northern Africa | 97.9 /100 | #98 | Exceptional 49.7% |
| Macedonians | 97.8 /100 | #99 | Exceptional 49.6% |
| Immigrants | Nepal | 97.5 /100 | #100 | Exceptional 49.5% |
| Northern Europeans | 97.3 /100 | #101 | Exceptional 49.5% |
| Chileans | 97.3 /100 | #102 | Exceptional 49.4% |