Iroquois vs Immigrants from Lithuania Poverty
COMPARE
Iroquois
Immigrants from Lithuania
Poverty
Poverty Comparison
Iroquois
Immigrants from Lithuania
14.5%
POVERTY
0.1/ 100
METRIC RATING
267th/ 347
METRIC RANK
10.3%
POVERTY
99.9/ 100
METRIC RATING
11th/ 347
METRIC RANK
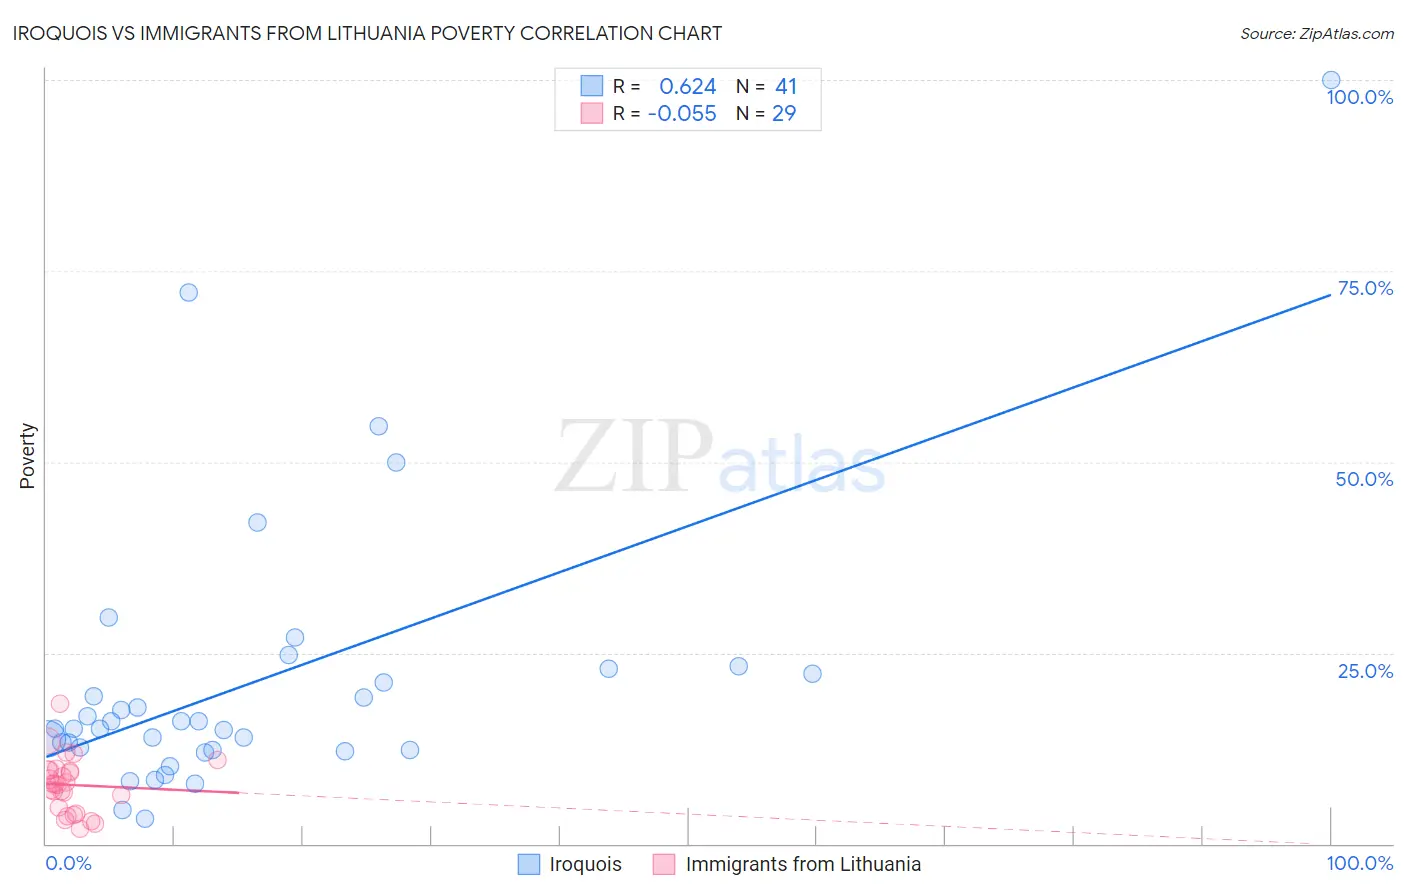
Iroquois vs Immigrants from Lithuania Poverty Correlation Chart
The statistical analysis conducted on geographies consisting of 207,260,268 people shows a significant positive correlation between the proportion of Iroquois and poverty level in the United States with a correlation coefficient (R) of 0.624 and weighted average of 14.5%. Similarly, the statistical analysis conducted on geographies consisting of 117,712,051 people shows a slight negative correlation between the proportion of Immigrants from Lithuania and poverty level in the United States with a correlation coefficient (R) of -0.055 and weighted average of 10.3%, a difference of 40.4%.
Poverty Correlation Summary
| Measurement | Iroquois | Immigrants from Lithuania |
| Minimum | 3.3% | 2.0% |
| Maximum | 100.0% | 18.3% |
| Range | 96.7% | 16.4% |
| Mean | 21.2% | 7.7% |
| Median | 15.1% | 7.9% |
| Interquartile 25% (IQ1) | 12.3% | 4.3% |
| Interquartile 75% (IQ3) | 22.6% | 9.6% |
| Interquartile Range (IQR) | 10.3% | 5.3% |
| Standard Deviation (Sample) | 18.5% | 3.7% |
| Standard Deviation (Population) | 18.3% | 3.6% |
Similar Demographics by Poverty
Demographics Similar to Iroquois by Poverty
In terms of poverty, the demographic groups most similar to Iroquois are Subsaharan African (14.5%, a difference of 0.040%), Immigrants from Cuba (14.6%, a difference of 0.19%), Guyanese (14.5%, a difference of 0.32%), Central American (14.6%, a difference of 0.33%), and Immigrants from Guyana (14.5%, a difference of 0.49%).
| Demographics | Rating | Rank | Poverty |
| Cape Verdeans | 0.1 /100 | #260 | Tragic 14.4% |
| Cherokee | 0.1 /100 | #261 | Tragic 14.4% |
| Immigrants | Liberia | 0.1 /100 | #262 | Tragic 14.4% |
| Jamaicans | 0.1 /100 | #263 | Tragic 14.4% |
| Immigrants | Jamaica | 0.1 /100 | #264 | Tragic 14.4% |
| Immigrants | Guyana | 0.1 /100 | #265 | Tragic 14.5% |
| Guyanese | 0.1 /100 | #266 | Tragic 14.5% |
| Iroquois | 0.1 /100 | #267 | Tragic 14.5% |
| Sub-Saharan Africans | 0.1 /100 | #268 | Tragic 14.5% |
| Immigrants | Cuba | 0.1 /100 | #269 | Tragic 14.6% |
| Central Americans | 0.1 /100 | #270 | Tragic 14.6% |
| Shoshone | 0.0 /100 | #271 | Tragic 14.7% |
| Chickasaw | 0.0 /100 | #272 | Tragic 14.7% |
| Spanish Americans | 0.0 /100 | #273 | Tragic 14.7% |
| Barbadians | 0.0 /100 | #274 | Tragic 14.8% |
Demographics Similar to Immigrants from Lithuania by Poverty
In terms of poverty, the demographic groups most similar to Immigrants from Lithuania are Bhutanese (10.4%, a difference of 0.35%), Immigrants from Hong Kong (10.4%, a difference of 0.57%), Immigrants from Bolivia (10.4%, a difference of 0.89%), Bolivian (10.4%, a difference of 0.89%), and Bulgarian (10.2%, a difference of 0.99%).
| Demographics | Rating | Rank | Poverty |
| Immigrants | Taiwan | 100.0 /100 | #4 | Exceptional 9.7% |
| Immigrants | Ireland | 99.9 /100 | #5 | Exceptional 10.1% |
| Assyrians/Chaldeans/Syriacs | 99.9 /100 | #6 | Exceptional 10.1% |
| Filipinos | 99.9 /100 | #7 | Exceptional 10.1% |
| Maltese | 99.9 /100 | #8 | Exceptional 10.2% |
| Immigrants | South Central Asia | 99.9 /100 | #9 | Exceptional 10.2% |
| Bulgarians | 99.9 /100 | #10 | Exceptional 10.2% |
| Immigrants | Lithuania | 99.9 /100 | #11 | Exceptional 10.3% |
| Bhutanese | 99.8 /100 | #12 | Exceptional 10.4% |
| Immigrants | Hong Kong | 99.8 /100 | #13 | Exceptional 10.4% |
| Immigrants | Bolivia | 99.8 /100 | #14 | Exceptional 10.4% |
| Bolivians | 99.8 /100 | #15 | Exceptional 10.4% |
| Lithuanians | 99.8 /100 | #16 | Exceptional 10.5% |
| Norwegians | 99.8 /100 | #17 | Exceptional 10.5% |
| Latvians | 99.8 /100 | #18 | Exceptional 10.5% |