Iroquois vs Immigrants from Lithuania Single Father Poverty
COMPARE
Iroquois
Immigrants from Lithuania
Single Father Poverty
Single Father Poverty Comparison
Iroquois
Immigrants from Lithuania
17.7%
SINGLE FATHER POVERTY
0.0/ 100
METRIC RATING
279th/ 347
METRIC RANK
15.3%
SINGLE FATHER POVERTY
99.6/ 100
METRIC RATING
72nd/ 347
METRIC RANK
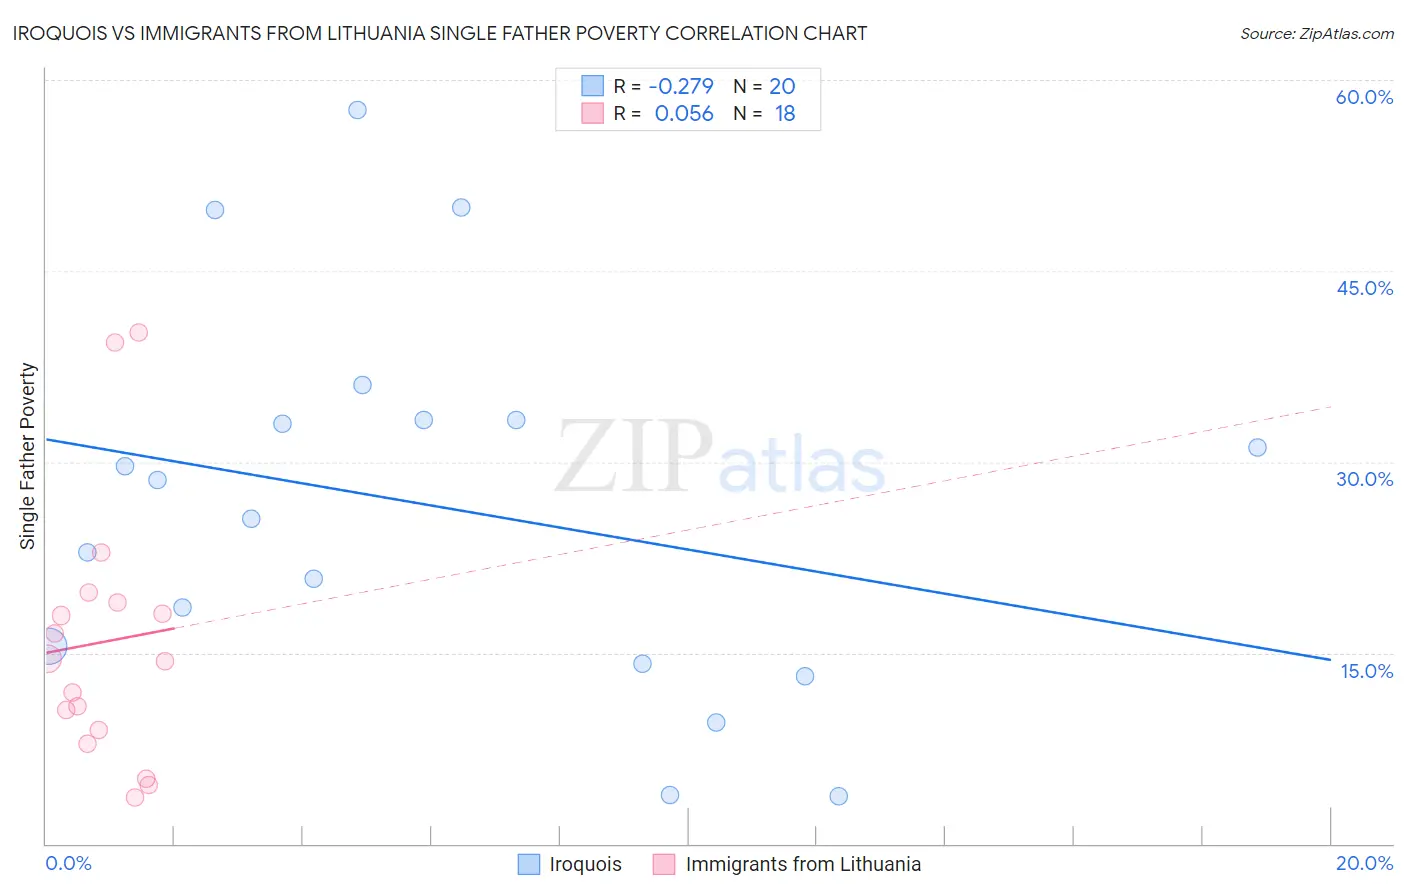
Iroquois vs Immigrants from Lithuania Single Father Poverty Correlation Chart
The statistical analysis conducted on geographies consisting of 177,877,486 people shows a weak negative correlation between the proportion of Iroquois and poverty level among single fathers in the United States with a correlation coefficient (R) of -0.279 and weighted average of 17.7%. Similarly, the statistical analysis conducted on geographies consisting of 100,005,444 people shows a slight positive correlation between the proportion of Immigrants from Lithuania and poverty level among single fathers in the United States with a correlation coefficient (R) of 0.056 and weighted average of 15.3%, a difference of 15.9%.
Single Father Poverty Correlation Summary
| Measurement | Iroquois | Immigrants from Lithuania |
| Minimum | 3.8% | 3.6% |
| Maximum | 57.7% | 40.2% |
| Range | 53.9% | 36.6% |
| Mean | 26.5% | 15.9% |
| Median | 27.1% | 14.4% |
| Interquartile 25% (IQ1) | 14.8% | 8.9% |
| Interquartile 75% (IQ3) | 33.3% | 18.9% |
| Interquartile Range (IQR) | 18.5% | 10.1% |
| Standard Deviation (Sample) | 14.9% | 10.3% |
| Standard Deviation (Population) | 14.5% | 10.0% |
Similar Demographics by Single Father Poverty
Demographics Similar to Iroquois by Single Father Poverty
In terms of single father poverty, the demographic groups most similar to Iroquois are Scottish (17.7%, a difference of 0.050%), German (17.7%, a difference of 0.15%), Lebanese (17.7%, a difference of 0.16%), German Russian (17.7%, a difference of 0.31%), and British West Indian (17.7%, a difference of 0.37%).
| Demographics | Rating | Rank | Single Father Poverty |
| Barbadians | 0.1 /100 | #272 | Tragic 17.5% |
| Italians | 0.1 /100 | #273 | Tragic 17.5% |
| Macedonians | 0.1 /100 | #274 | Tragic 17.7% |
| British West Indians | 0.0 /100 | #275 | Tragic 17.7% |
| German Russians | 0.0 /100 | #276 | Tragic 17.7% |
| Lebanese | 0.0 /100 | #277 | Tragic 17.7% |
| Germans | 0.0 /100 | #278 | Tragic 17.7% |
| Iroquois | 0.0 /100 | #279 | Tragic 17.7% |
| Scottish | 0.0 /100 | #280 | Tragic 17.7% |
| English | 0.0 /100 | #281 | Tragic 17.8% |
| Dutch | 0.0 /100 | #282 | Tragic 17.8% |
| Alsatians | 0.0 /100 | #283 | Tragic 17.8% |
| Welsh | 0.0 /100 | #284 | Tragic 17.8% |
| Immigrants | Lebanon | 0.0 /100 | #285 | Tragic 17.9% |
| Immigrants | North Macedonia | 0.0 /100 | #286 | Tragic 17.9% |
Demographics Similar to Immigrants from Lithuania by Single Father Poverty
In terms of single father poverty, the demographic groups most similar to Immigrants from Lithuania are Kenyan (15.3%, a difference of 0.090%), Immigrants from Brazil (15.3%, a difference of 0.12%), Maltese (15.3%, a difference of 0.13%), Immigrants from Turkey (15.3%, a difference of 0.15%), and Immigrants from Japan (15.3%, a difference of 0.23%).
| Demographics | Rating | Rank | Single Father Poverty |
| Immigrants | Malaysia | 99.8 /100 | #65 | Exceptional 15.2% |
| Immigrants | Moldova | 99.8 /100 | #66 | Exceptional 15.2% |
| Paraguayans | 99.7 /100 | #67 | Exceptional 15.2% |
| Immigrants | Cameroon | 99.7 /100 | #68 | Exceptional 15.2% |
| Japanese | 99.7 /100 | #69 | Exceptional 15.2% |
| Mongolians | 99.7 /100 | #70 | Exceptional 15.3% |
| Immigrants | Brazil | 99.6 /100 | #71 | Exceptional 15.3% |
| Immigrants | Lithuania | 99.6 /100 | #72 | Exceptional 15.3% |
| Kenyans | 99.6 /100 | #73 | Exceptional 15.3% |
| Maltese | 99.6 /100 | #74 | Exceptional 15.3% |
| Immigrants | Turkey | 99.5 /100 | #75 | Exceptional 15.3% |
| Immigrants | Japan | 99.5 /100 | #76 | Exceptional 15.3% |
| Immigrants | Peru | 99.5 /100 | #77 | Exceptional 15.3% |
| Tlingit-Haida | 99.5 /100 | #78 | Exceptional 15.3% |
| Immigrants | Northern Africa | 99.5 /100 | #79 | Exceptional 15.3% |