Immigrants from Caribbean vs Immigrants from Lithuania GED/Equivalency
COMPARE
Immigrants from Caribbean
Immigrants from Lithuania
GED/Equivalency
GED/Equivalency Comparison
Immigrants from Caribbean
Immigrants from Lithuania
80.5%
GED/EQUIVALENCY
0.0/ 100
METRIC RATING
317th/ 347
METRIC RANK
88.6%
GED/EQUIVALENCY
99.8/ 100
METRIC RATING
27th/ 347
METRIC RANK
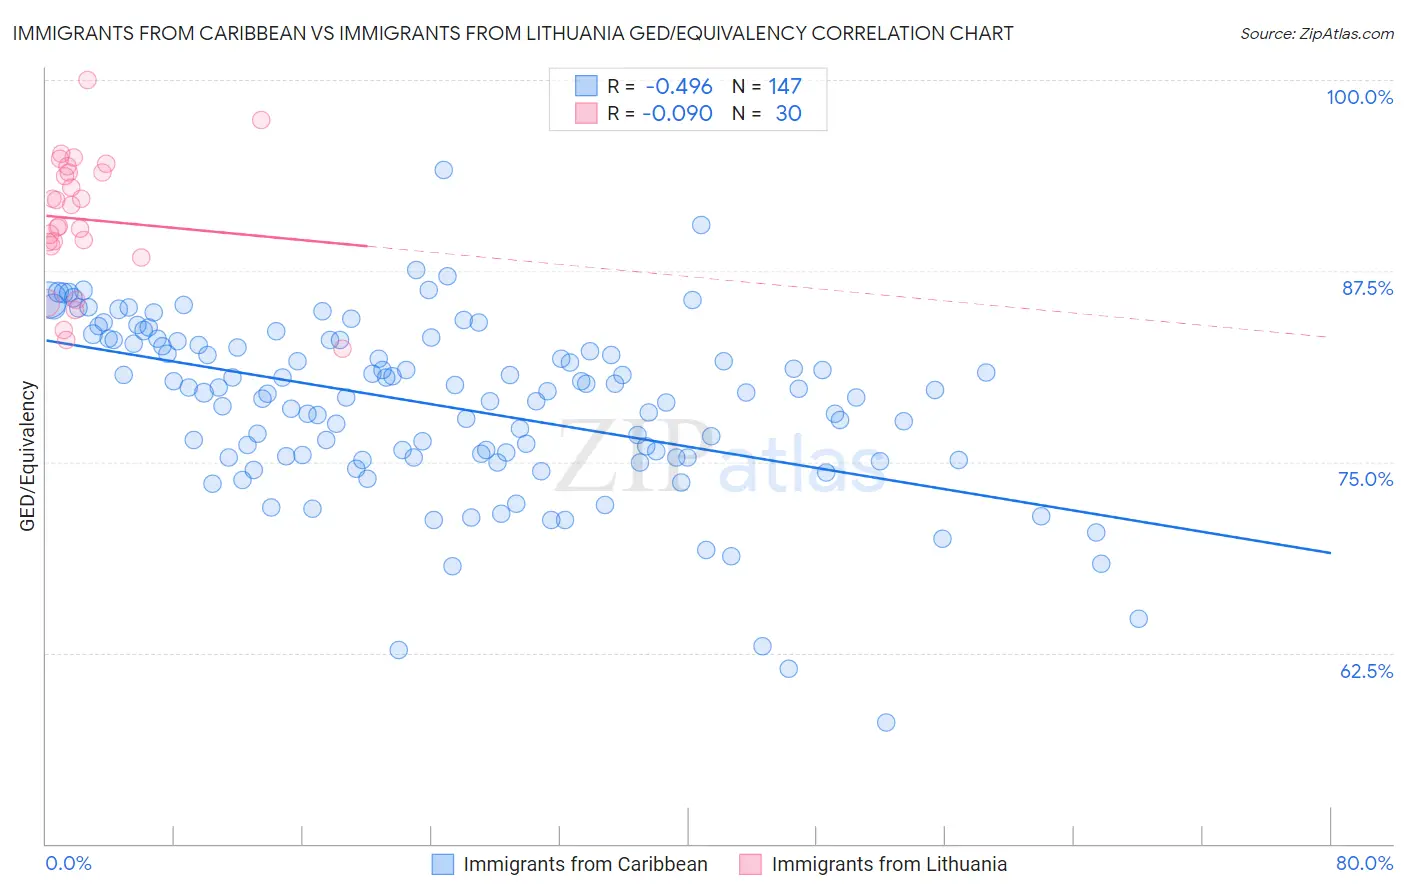
Immigrants from Caribbean vs Immigrants from Lithuania GED/Equivalency Correlation Chart
The statistical analysis conducted on geographies consisting of 450,064,654 people shows a moderate negative correlation between the proportion of Immigrants from Caribbean and percentage of population with at least ged/equivalency education in the United States with a correlation coefficient (R) of -0.496 and weighted average of 80.5%. Similarly, the statistical analysis conducted on geographies consisting of 117,724,932 people shows a slight negative correlation between the proportion of Immigrants from Lithuania and percentage of population with at least ged/equivalency education in the United States with a correlation coefficient (R) of -0.090 and weighted average of 88.6%, a difference of 10.0%.
GED/Equivalency Correlation Summary
| Measurement | Immigrants from Caribbean | Immigrants from Lithuania |
| Minimum | 58.0% | 82.4% |
| Maximum | 94.1% | 100.0% |
| Range | 36.2% | 17.6% |
| Mean | 78.7% | 90.9% |
| Median | 79.5% | 91.1% |
| Interquartile 25% (IQ1) | 75.3% | 89.2% |
| Interquartile 75% (IQ3) | 82.9% | 94.0% |
| Interquartile Range (IQR) | 7.6% | 4.8% |
| Standard Deviation (Sample) | 5.7% | 4.3% |
| Standard Deviation (Population) | 5.7% | 4.2% |
Similar Demographics by GED/Equivalency
Demographics Similar to Immigrants from Caribbean by GED/Equivalency
In terms of ged/equivalency, the demographic groups most similar to Immigrants from Caribbean are Yaqui (80.5%, a difference of 0.020%), Immigrants from Belize (80.5%, a difference of 0.020%), Central American Indian (80.6%, a difference of 0.10%), Apache (80.7%, a difference of 0.24%), and Immigrants from Cuba (80.2%, a difference of 0.43%).
| Demographics | Rating | Rank | GED/Equivalency |
| Immigrants | Guyana | 0.0 /100 | #310 | Tragic 81.0% |
| Natives/Alaskans | 0.0 /100 | #311 | Tragic 80.9% |
| Nicaraguans | 0.0 /100 | #312 | Tragic 80.9% |
| Cape Verdeans | 0.0 /100 | #313 | Tragic 80.9% |
| Belizeans | 0.0 /100 | #314 | Tragic 80.9% |
| Apache | 0.0 /100 | #315 | Tragic 80.7% |
| Central American Indians | 0.0 /100 | #316 | Tragic 80.6% |
| Immigrants | Caribbean | 0.0 /100 | #317 | Tragic 80.5% |
| Yaqui | 0.0 /100 | #318 | Tragic 80.5% |
| Immigrants | Belize | 0.0 /100 | #319 | Tragic 80.5% |
| Immigrants | Cuba | 0.0 /100 | #320 | Tragic 80.2% |
| Yup'ik | 0.0 /100 | #321 | Tragic 80.0% |
| Lumbee | 0.0 /100 | #322 | Tragic 80.0% |
| Immigrants | Nicaragua | 0.0 /100 | #323 | Tragic 79.9% |
| Mexican American Indians | 0.0 /100 | #324 | Tragic 79.4% |
Demographics Similar to Immigrants from Lithuania by GED/Equivalency
In terms of ged/equivalency, the demographic groups most similar to Immigrants from Lithuania are Immigrants from Australia (88.6%, a difference of 0.030%), Russian (88.6%, a difference of 0.040%), Slovak (88.6%, a difference of 0.040%), Estonian (88.6%, a difference of 0.040%), and Immigrants from Northern Europe (88.5%, a difference of 0.040%).
| Demographics | Rating | Rank | GED/Equivalency |
| Maltese | 99.9 /100 | #20 | Exceptional 88.6% |
| Luxembourgers | 99.8 /100 | #21 | Exceptional 88.6% |
| Immigrants | Ireland | 99.8 /100 | #22 | Exceptional 88.6% |
| Russians | 99.8 /100 | #23 | Exceptional 88.6% |
| Slovaks | 99.8 /100 | #24 | Exceptional 88.6% |
| Estonians | 99.8 /100 | #25 | Exceptional 88.6% |
| Immigrants | Australia | 99.8 /100 | #26 | Exceptional 88.6% |
| Immigrants | Lithuania | 99.8 /100 | #27 | Exceptional 88.6% |
| Immigrants | Northern Europe | 99.8 /100 | #28 | Exceptional 88.5% |
| Poles | 99.8 /100 | #29 | Exceptional 88.5% |
| Turks | 99.8 /100 | #30 | Exceptional 88.5% |
| Bhutanese | 99.8 /100 | #31 | Exceptional 88.4% |
| Danes | 99.8 /100 | #32 | Exceptional 88.4% |
| Immigrants | Sweden | 99.7 /100 | #33 | Exceptional 88.4% |
| Immigrants | Japan | 99.7 /100 | #34 | Exceptional 88.4% |