Immigrants from Eastern Europe vs Immigrants from Lithuania GED/Equivalency
COMPARE
Immigrants from Eastern Europe
Immigrants from Lithuania
GED/Equivalency
GED/Equivalency Comparison
Immigrants from Eastern Europe
Immigrants from Lithuania
87.1%
GED/EQUIVALENCY
95.5/ 100
METRIC RATING
109th/ 347
METRIC RANK
88.6%
GED/EQUIVALENCY
99.8/ 100
METRIC RATING
27th/ 347
METRIC RANK
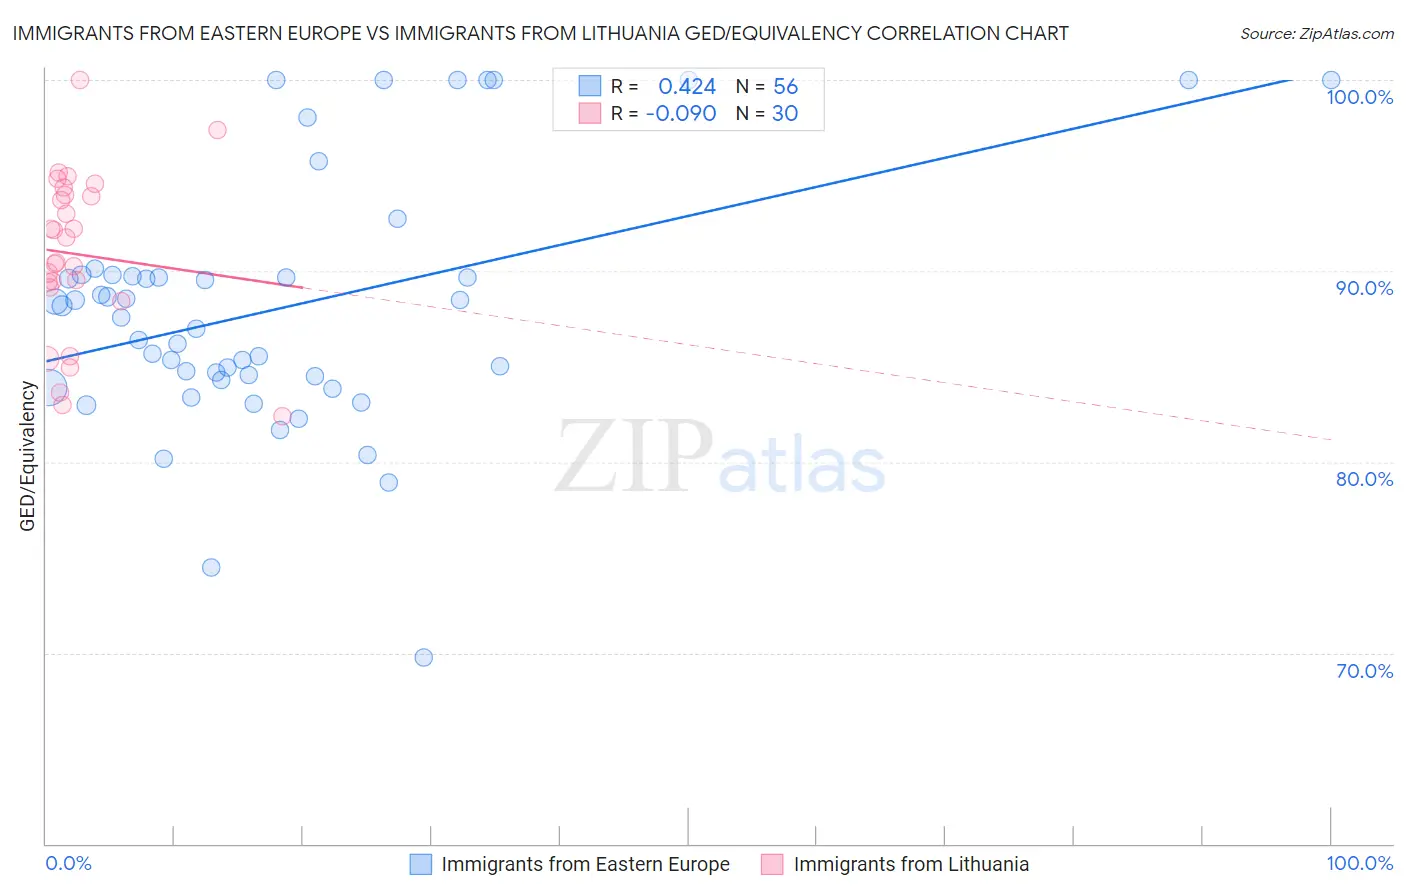
Immigrants from Eastern Europe vs Immigrants from Lithuania GED/Equivalency Correlation Chart
The statistical analysis conducted on geographies consisting of 475,879,420 people shows a moderate positive correlation between the proportion of Immigrants from Eastern Europe and percentage of population with at least ged/equivalency education in the United States with a correlation coefficient (R) of 0.424 and weighted average of 87.1%. Similarly, the statistical analysis conducted on geographies consisting of 117,724,932 people shows a slight negative correlation between the proportion of Immigrants from Lithuania and percentage of population with at least ged/equivalency education in the United States with a correlation coefficient (R) of -0.090 and weighted average of 88.6%, a difference of 1.7%.
GED/Equivalency Correlation Summary
| Measurement | Immigrants from Eastern Europe | Immigrants from Lithuania |
| Minimum | 69.7% | 82.4% |
| Maximum | 100.0% | 100.0% |
| Range | 30.3% | 17.6% |
| Mean | 88.1% | 90.9% |
| Median | 87.9% | 91.1% |
| Interquartile 25% (IQ1) | 84.4% | 89.2% |
| Interquartile 75% (IQ3) | 89.7% | 94.0% |
| Interquartile Range (IQR) | 5.4% | 4.8% |
| Standard Deviation (Sample) | 6.6% | 4.3% |
| Standard Deviation (Population) | 6.5% | 4.2% |
Similar Demographics by GED/Equivalency
Demographics Similar to Immigrants from Eastern Europe by GED/Equivalency
In terms of ged/equivalency, the demographic groups most similar to Immigrants from Eastern Europe are Canadian (87.1%, a difference of 0.010%), Icelander (87.1%, a difference of 0.030%), Egyptian (87.1%, a difference of 0.030%), French (87.1%, a difference of 0.030%), and Immigrants from Zimbabwe (87.1%, a difference of 0.040%).
| Demographics | Rating | Rank | GED/Equivalency |
| Lebanese | 96.2 /100 | #102 | Exceptional 87.2% |
| Jordanians | 96.1 /100 | #103 | Exceptional 87.2% |
| Immigrants | Hungary | 96.0 /100 | #104 | Exceptional 87.2% |
| Indians (Asian) | 95.9 /100 | #105 | Exceptional 87.1% |
| Immigrants | Zimbabwe | 95.8 /100 | #106 | Exceptional 87.1% |
| Icelanders | 95.7 /100 | #107 | Exceptional 87.1% |
| Canadians | 95.6 /100 | #108 | Exceptional 87.1% |
| Immigrants | Eastern Europe | 95.5 /100 | #109 | Exceptional 87.1% |
| Egyptians | 95.3 /100 | #110 | Exceptional 87.1% |
| French | 95.2 /100 | #111 | Exceptional 87.1% |
| Tlingit-Haida | 94.8 /100 | #112 | Exceptional 87.0% |
| Assyrians/Chaldeans/Syriacs | 94.8 /100 | #113 | Exceptional 87.0% |
| Immigrants | Kazakhstan | 94.7 /100 | #114 | Exceptional 87.0% |
| Mongolians | 94.6 /100 | #115 | Exceptional 87.0% |
| Swiss | 94.5 /100 | #116 | Exceptional 87.0% |
Demographics Similar to Immigrants from Lithuania by GED/Equivalency
In terms of ged/equivalency, the demographic groups most similar to Immigrants from Lithuania are Immigrants from Australia (88.6%, a difference of 0.030%), Russian (88.6%, a difference of 0.040%), Slovak (88.6%, a difference of 0.040%), Estonian (88.6%, a difference of 0.040%), and Immigrants from Northern Europe (88.5%, a difference of 0.040%).
| Demographics | Rating | Rank | GED/Equivalency |
| Maltese | 99.9 /100 | #20 | Exceptional 88.6% |
| Luxembourgers | 99.8 /100 | #21 | Exceptional 88.6% |
| Immigrants | Ireland | 99.8 /100 | #22 | Exceptional 88.6% |
| Russians | 99.8 /100 | #23 | Exceptional 88.6% |
| Slovaks | 99.8 /100 | #24 | Exceptional 88.6% |
| Estonians | 99.8 /100 | #25 | Exceptional 88.6% |
| Immigrants | Australia | 99.8 /100 | #26 | Exceptional 88.6% |
| Immigrants | Lithuania | 99.8 /100 | #27 | Exceptional 88.6% |
| Immigrants | Northern Europe | 99.8 /100 | #28 | Exceptional 88.5% |
| Poles | 99.8 /100 | #29 | Exceptional 88.5% |
| Turks | 99.8 /100 | #30 | Exceptional 88.5% |
| Bhutanese | 99.8 /100 | #31 | Exceptional 88.4% |
| Danes | 99.8 /100 | #32 | Exceptional 88.4% |
| Immigrants | Sweden | 99.7 /100 | #33 | Exceptional 88.4% |
| Immigrants | Japan | 99.7 /100 | #34 | Exceptional 88.4% |