Immigrants vs Immigrants from Iran Nursery School
COMPARE
Immigrants
Immigrants from Iran
Nursery School
Nursery School Comparison
Immigrants
Immigrants from Iran
97.2%
NURSERY SCHOOL
0.0/ 100
METRIC RATING
295th/ 347
METRIC RANK
98.0%
NURSERY SCHOOL
68.7/ 100
METRIC RATING
154th/ 347
METRIC RANK
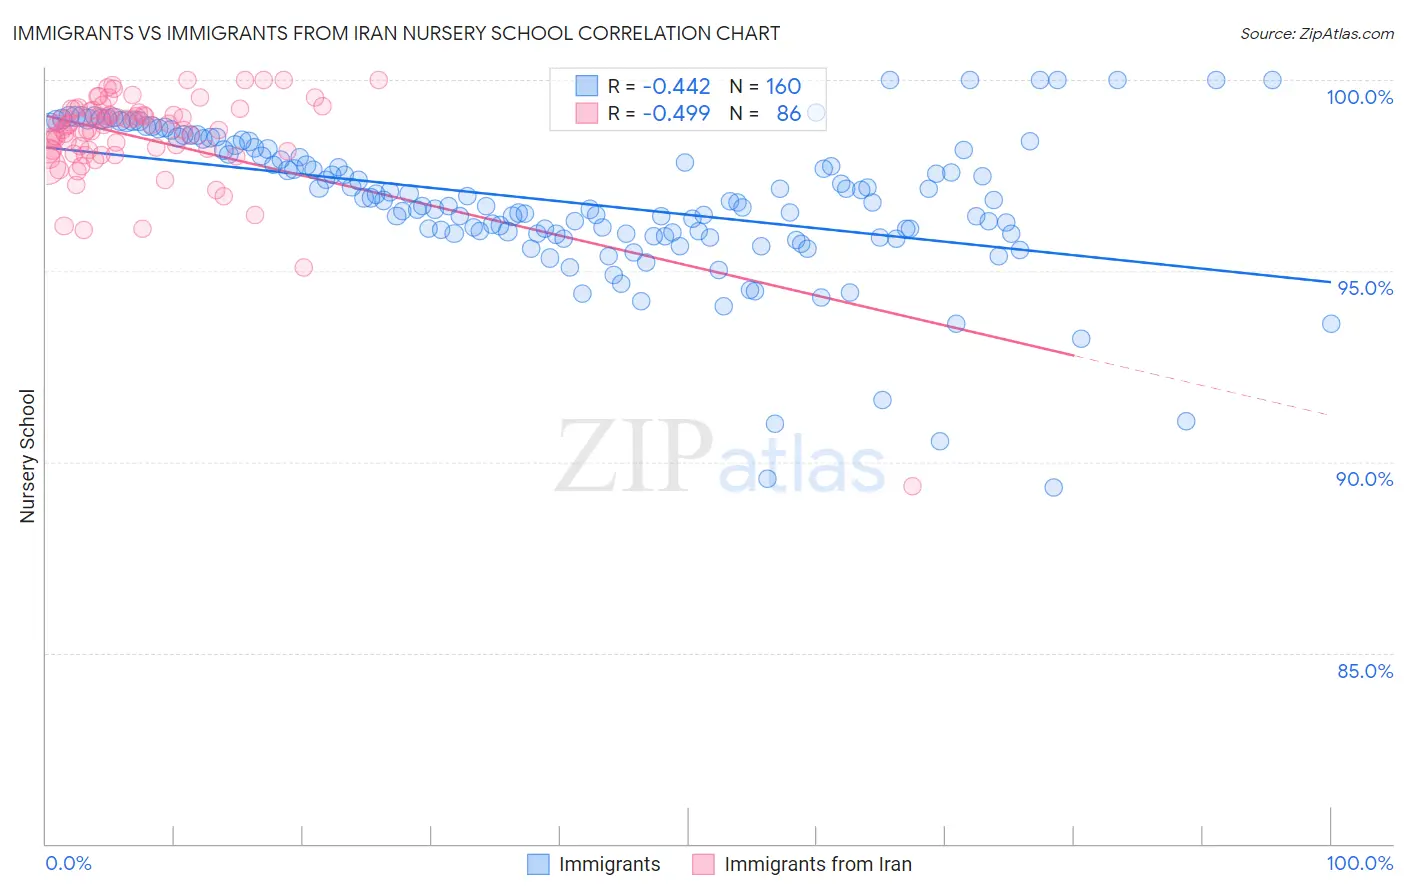
Immigrants vs Immigrants from Iran Nursery School Correlation Chart
The statistical analysis conducted on geographies consisting of 577,788,049 people shows a moderate negative correlation between the proportion of Immigrants and percentage of population with at least nursery school education in the United States with a correlation coefficient (R) of -0.442 and weighted average of 97.2%. Similarly, the statistical analysis conducted on geographies consisting of 279,886,762 people shows a moderate negative correlation between the proportion of Immigrants from Iran and percentage of population with at least nursery school education in the United States with a correlation coefficient (R) of -0.499 and weighted average of 98.0%, a difference of 0.81%.
Nursery School Correlation Summary
| Measurement | Immigrants | Immigrants from Iran |
| Minimum | 89.3% | 89.4% |
| Maximum | 100.0% | 100.0% |
| Range | 10.7% | 10.6% |
| Mean | 96.8% | 98.5% |
| Median | 96.8% | 98.8% |
| Interquartile 25% (IQ1) | 96.0% | 98.1% |
| Interquartile 75% (IQ3) | 98.2% | 99.2% |
| Interquartile Range (IQR) | 2.2% | 1.1% |
| Standard Deviation (Sample) | 1.9% | 1.4% |
| Standard Deviation (Population) | 1.9% | 1.4% |
Similar Demographics by Nursery School
Demographics Similar to Immigrants by Nursery School
In terms of nursery school, the demographic groups most similar to Immigrants are Immigrants from Grenada (97.3%, a difference of 0.010%), Immigrants from Eritrea (97.2%, a difference of 0.010%), Malaysian (97.3%, a difference of 0.020%), Houma (97.3%, a difference of 0.030%), and British West Indian (97.3%, a difference of 0.050%).
| Demographics | Rating | Rank | Nursery School |
| Immigrants | Thailand | 0.0 /100 | #288 | Tragic 97.3% |
| Immigrants | St. Vincent and the Grenadines | 0.0 /100 | #289 | Tragic 97.3% |
| Immigrants | Afghanistan | 0.0 /100 | #290 | Tragic 97.3% |
| British West Indians | 0.0 /100 | #291 | Tragic 97.3% |
| Houma | 0.0 /100 | #292 | Tragic 97.3% |
| Malaysians | 0.0 /100 | #293 | Tragic 97.3% |
| Immigrants | Grenada | 0.0 /100 | #294 | Tragic 97.3% |
| Immigrants | Immigrants | 0.0 /100 | #295 | Tragic 97.2% |
| Immigrants | Eritrea | 0.0 /100 | #296 | Tragic 97.2% |
| Immigrants | Cuba | 0.0 /100 | #297 | Tragic 97.2% |
| Central American Indians | 0.0 /100 | #298 | Tragic 97.2% |
| Immigrants | Dominica | 0.0 /100 | #299 | Tragic 97.2% |
| Haitians | 0.0 /100 | #300 | Tragic 97.2% |
| Immigrants | South Eastern Asia | 0.0 /100 | #301 | Tragic 97.1% |
| Immigrants | Caribbean | 0.0 /100 | #302 | Tragic 97.1% |
Demographics Similar to Immigrants from Iran by Nursery School
In terms of nursery school, the demographic groups most similar to Immigrants from Iran are Immigrants from Moldova (98.0%, a difference of 0.0%), Soviet Union (98.0%, a difference of 0.010%), Dutch West Indian (98.0%, a difference of 0.010%), Immigrants from South Central Asia (98.0%, a difference of 0.010%), and Venezuelan (98.0%, a difference of 0.010%).
| Demographics | Rating | Rank | Nursery School |
| Hmong | 75.7 /100 | #147 | Good 98.1% |
| Immigrants | Greece | 75.4 /100 | #148 | Good 98.1% |
| Apache | 73.2 /100 | #149 | Good 98.1% |
| Jordanians | 72.9 /100 | #150 | Good 98.1% |
| Soviet Union | 71.6 /100 | #151 | Good 98.0% |
| Dutch West Indians | 70.2 /100 | #152 | Good 98.0% |
| Immigrants | Moldova | 69.6 /100 | #153 | Good 98.0% |
| Immigrants | Iran | 68.7 /100 | #154 | Good 98.0% |
| Immigrants | South Central Asia | 66.7 /100 | #155 | Good 98.0% |
| Venezuelans | 66.6 /100 | #156 | Good 98.0% |
| Comanche | 66.0 /100 | #157 | Good 98.0% |
| Immigrants | North Macedonia | 65.7 /100 | #158 | Good 98.0% |
| French American Indians | 62.1 /100 | #159 | Good 98.0% |
| Immigrants | Russia | 59.9 /100 | #160 | Average 98.0% |
| Immigrants | Eastern Europe | 59.7 /100 | #161 | Average 98.0% |