Delaware vs Immigrants from Iran Nursery School
COMPARE
Delaware
Immigrants from Iran
Nursery School
Nursery School Comparison
Delaware
Immigrants from Iran
98.3%
NURSERY SCHOOL
99.3/ 100
METRIC RATING
78th/ 347
METRIC RANK
98.0%
NURSERY SCHOOL
68.7/ 100
METRIC RATING
154th/ 347
METRIC RANK
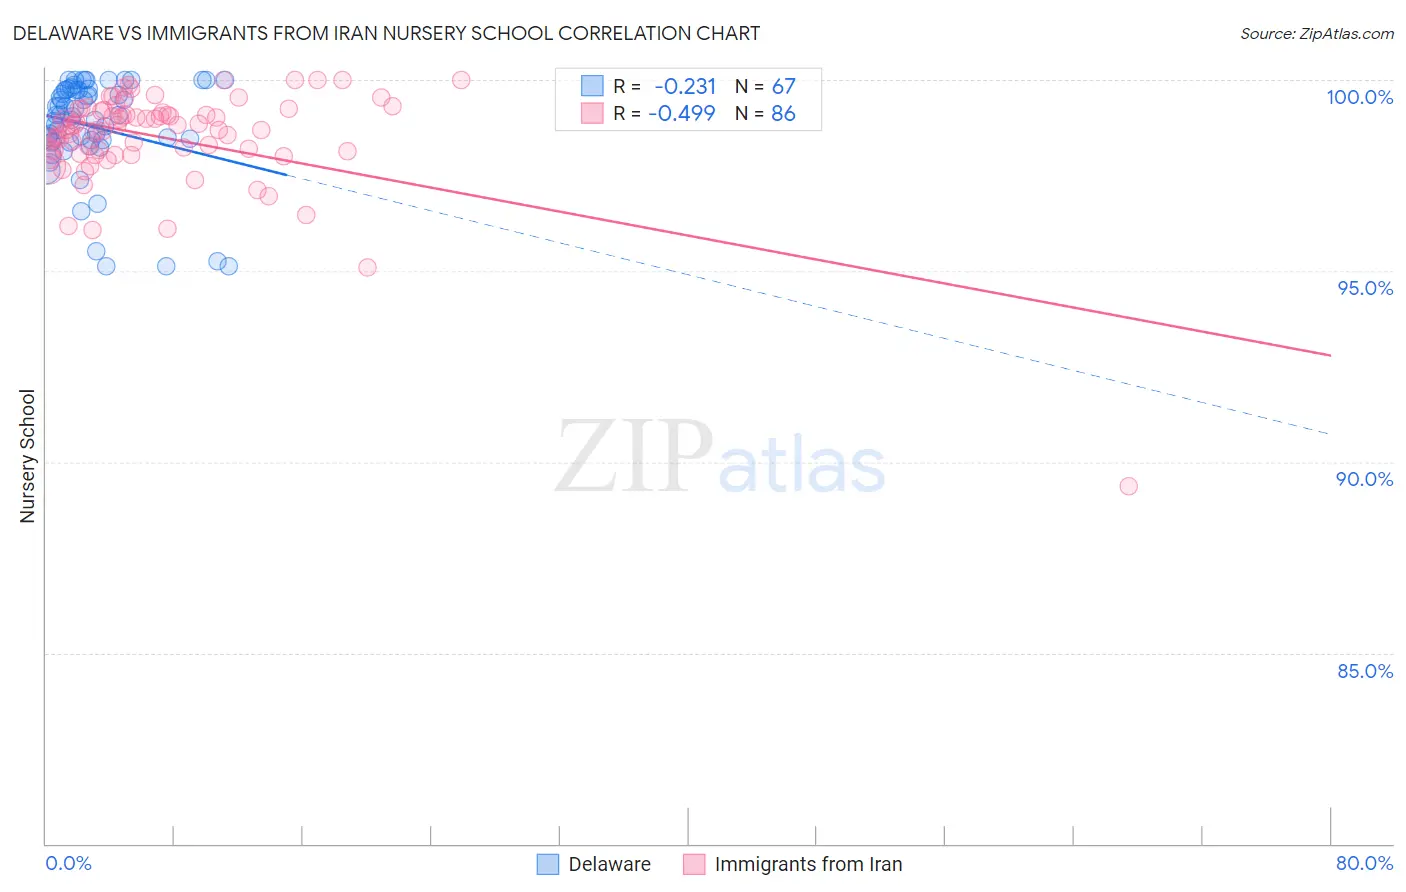
Delaware vs Immigrants from Iran Nursery School Correlation Chart
The statistical analysis conducted on geographies consisting of 96,234,470 people shows a weak negative correlation between the proportion of Delaware and percentage of population with at least nursery school education in the United States with a correlation coefficient (R) of -0.231 and weighted average of 98.3%. Similarly, the statistical analysis conducted on geographies consisting of 279,886,762 people shows a moderate negative correlation between the proportion of Immigrants from Iran and percentage of population with at least nursery school education in the United States with a correlation coefficient (R) of -0.499 and weighted average of 98.0%, a difference of 0.31%.
Nursery School Correlation Summary
| Measurement | Delaware | Immigrants from Iran |
| Minimum | 95.1% | 89.4% |
| Maximum | 100.0% | 100.0% |
| Range | 4.9% | 10.6% |
| Mean | 98.8% | 98.5% |
| Median | 99.1% | 98.8% |
| Interquartile 25% (IQ1) | 98.4% | 98.1% |
| Interquartile 75% (IQ3) | 99.7% | 99.2% |
| Interquartile Range (IQR) | 1.3% | 1.1% |
| Standard Deviation (Sample) | 1.3% | 1.4% |
| Standard Deviation (Population) | 1.3% | 1.4% |
Similar Demographics by Nursery School
Demographics Similar to Delaware by Nursery School
In terms of nursery school, the demographic groups most similar to Delaware are Cherokee (98.3%, a difference of 0.0%), Immigrants from England (98.3%, a difference of 0.0%), Immigrants from Lithuania (98.3%, a difference of 0.0%), Immigrants from Belgium (98.3%, a difference of 0.0%), and Shoshone (98.3%, a difference of 0.0%).
| Demographics | Rating | Rank | Nursery School |
| Serbians | 99.6 /100 | #71 | Exceptional 98.4% |
| Chickasaw | 99.6 /100 | #72 | Exceptional 98.4% |
| Cajuns | 99.4 /100 | #73 | Exceptional 98.4% |
| Immigrants | Netherlands | 99.4 /100 | #74 | Exceptional 98.4% |
| Cherokee | 99.3 /100 | #75 | Exceptional 98.3% |
| Immigrants | England | 99.3 /100 | #76 | Exceptional 98.3% |
| Immigrants | Lithuania | 99.3 /100 | #77 | Exceptional 98.3% |
| Delaware | 99.3 /100 | #78 | Exceptional 98.3% |
| Immigrants | Belgium | 99.3 /100 | #79 | Exceptional 98.3% |
| Shoshone | 99.3 /100 | #80 | Exceptional 98.3% |
| Icelanders | 99.2 /100 | #81 | Exceptional 98.3% |
| Potawatomi | 99.2 /100 | #82 | Exceptional 98.3% |
| Osage | 99.1 /100 | #83 | Exceptional 98.3% |
| Immigrants | Denmark | 99.1 /100 | #84 | Exceptional 98.3% |
| Immigrants | Sweden | 99.1 /100 | #85 | Exceptional 98.3% |
Demographics Similar to Immigrants from Iran by Nursery School
In terms of nursery school, the demographic groups most similar to Immigrants from Iran are Immigrants from Moldova (98.0%, a difference of 0.0%), Soviet Union (98.0%, a difference of 0.010%), Dutch West Indian (98.0%, a difference of 0.010%), Immigrants from South Central Asia (98.0%, a difference of 0.010%), and Venezuelan (98.0%, a difference of 0.010%).
| Demographics | Rating | Rank | Nursery School |
| Hmong | 75.7 /100 | #147 | Good 98.1% |
| Immigrants | Greece | 75.4 /100 | #148 | Good 98.1% |
| Apache | 73.2 /100 | #149 | Good 98.1% |
| Jordanians | 72.9 /100 | #150 | Good 98.1% |
| Soviet Union | 71.6 /100 | #151 | Good 98.0% |
| Dutch West Indians | 70.2 /100 | #152 | Good 98.0% |
| Immigrants | Moldova | 69.6 /100 | #153 | Good 98.0% |
| Immigrants | Iran | 68.7 /100 | #154 | Good 98.0% |
| Immigrants | South Central Asia | 66.7 /100 | #155 | Good 98.0% |
| Venezuelans | 66.6 /100 | #156 | Good 98.0% |
| Comanche | 66.0 /100 | #157 | Good 98.0% |
| Immigrants | North Macedonia | 65.7 /100 | #158 | Good 98.0% |
| French American Indians | 62.1 /100 | #159 | Good 98.0% |
| Immigrants | Russia | 59.9 /100 | #160 | Average 98.0% |
| Immigrants | Eastern Europe | 59.7 /100 | #161 | Average 98.0% |