Immigrants from Indonesia vs Immigrants from Iran Nursery School
COMPARE
Immigrants from Indonesia
Immigrants from Iran
Nursery School
Nursery School Comparison
Immigrants from Indonesia
Immigrants from Iran
97.7%
NURSERY SCHOOL
1.1/ 100
METRIC RATING
241st/ 347
METRIC RANK
98.0%
NURSERY SCHOOL
68.7/ 100
METRIC RATING
154th/ 347
METRIC RANK
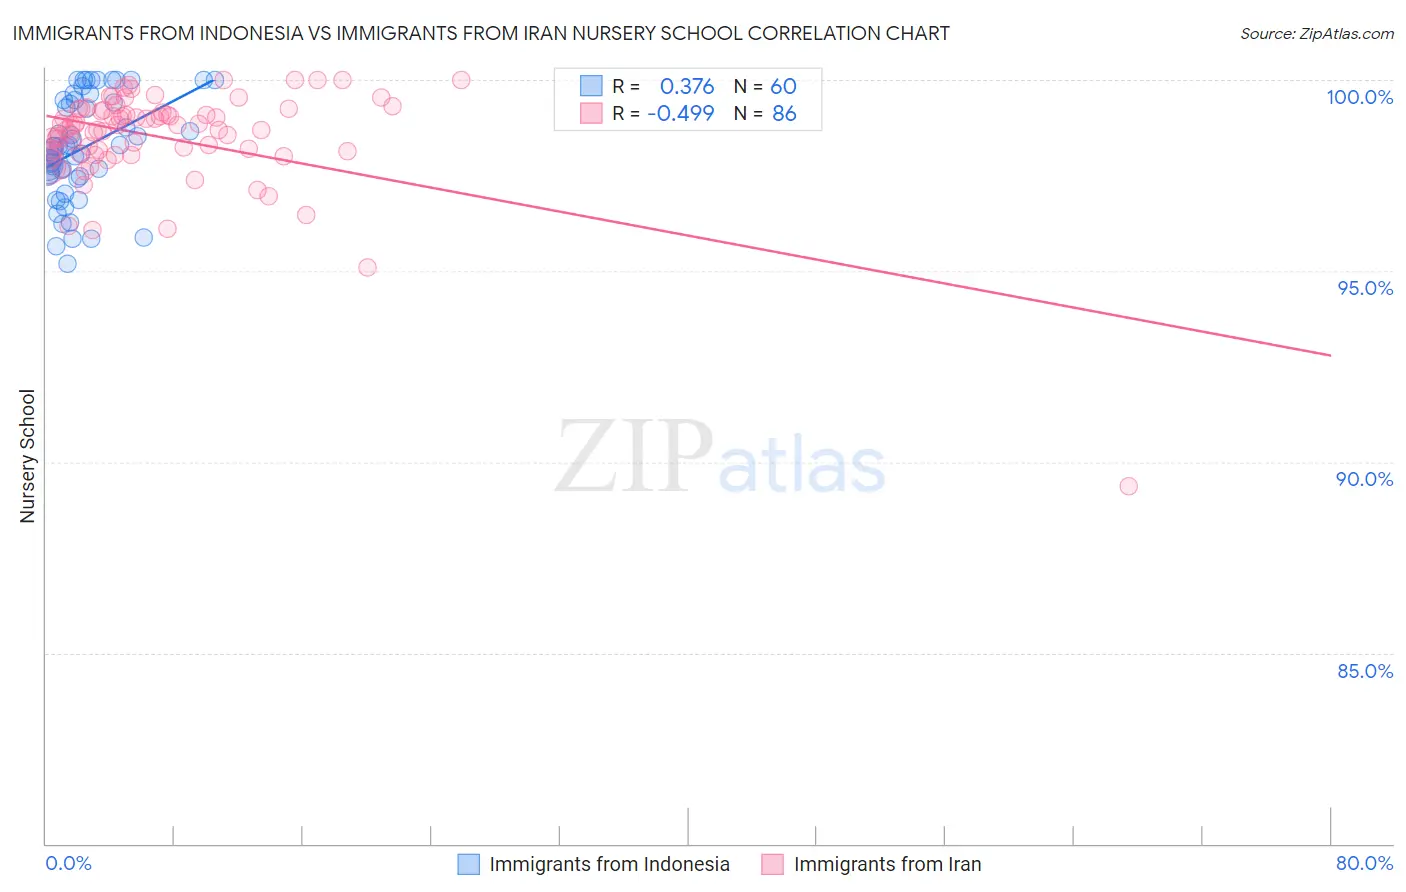
Immigrants from Indonesia vs Immigrants from Iran Nursery School Correlation Chart
The statistical analysis conducted on geographies consisting of 215,783,142 people shows a mild positive correlation between the proportion of Immigrants from Indonesia and percentage of population with at least nursery school education in the United States with a correlation coefficient (R) of 0.376 and weighted average of 97.7%. Similarly, the statistical analysis conducted on geographies consisting of 279,886,762 people shows a moderate negative correlation between the proportion of Immigrants from Iran and percentage of population with at least nursery school education in the United States with a correlation coefficient (R) of -0.499 and weighted average of 98.0%, a difference of 0.40%.
Nursery School Correlation Summary
| Measurement | Immigrants from Indonesia | Immigrants from Iran |
| Minimum | 95.2% | 89.4% |
| Maximum | 100.0% | 100.0% |
| Range | 4.8% | 10.6% |
| Mean | 98.2% | 98.5% |
| Median | 98.3% | 98.8% |
| Interquartile 25% (IQ1) | 97.5% | 98.1% |
| Interquartile 75% (IQ3) | 99.4% | 99.2% |
| Interquartile Range (IQR) | 1.9% | 1.1% |
| Standard Deviation (Sample) | 1.3% | 1.4% |
| Standard Deviation (Population) | 1.3% | 1.4% |
Similar Demographics by Nursery School
Demographics Similar to Immigrants from Indonesia by Nursery School
In terms of nursery school, the demographic groups most similar to Immigrants from Indonesia are Liberian (97.7%, a difference of 0.0%), Asian (97.6%, a difference of 0.010%), South American (97.6%, a difference of 0.010%), Bolivian (97.6%, a difference of 0.010%), and Peruvian (97.6%, a difference of 0.010%).
| Demographics | Rating | Rank | Nursery School |
| Colombians | 2.1 /100 | #234 | Tragic 97.7% |
| Immigrants | Pakistan | 2.1 /100 | #235 | Tragic 97.7% |
| Immigrants | Malaysia | 1.9 /100 | #236 | Tragic 97.7% |
| Immigrants | Western Asia | 1.9 /100 | #237 | Tragic 97.7% |
| Nigerians | 1.7 /100 | #238 | Tragic 97.7% |
| Immigrants | Eastern Asia | 1.6 /100 | #239 | Tragic 97.7% |
| Koreans | 1.4 /100 | #240 | Tragic 97.7% |
| Immigrants | Indonesia | 1.1 /100 | #241 | Tragic 97.7% |
| Liberians | 1.1 /100 | #242 | Tragic 97.7% |
| Asians | 1.1 /100 | #243 | Tragic 97.6% |
| South Americans | 1.0 /100 | #244 | Tragic 97.6% |
| Bolivians | 1.0 /100 | #245 | Tragic 97.6% |
| Peruvians | 1.0 /100 | #246 | Tragic 97.6% |
| Immigrants | Middle Africa | 0.9 /100 | #247 | Tragic 97.6% |
| Indians (Asian) | 0.9 /100 | #248 | Tragic 97.6% |
Demographics Similar to Immigrants from Iran by Nursery School
In terms of nursery school, the demographic groups most similar to Immigrants from Iran are Immigrants from Moldova (98.0%, a difference of 0.0%), Soviet Union (98.0%, a difference of 0.010%), Dutch West Indian (98.0%, a difference of 0.010%), Immigrants from South Central Asia (98.0%, a difference of 0.010%), and Venezuelan (98.0%, a difference of 0.010%).
| Demographics | Rating | Rank | Nursery School |
| Hmong | 75.7 /100 | #147 | Good 98.1% |
| Immigrants | Greece | 75.4 /100 | #148 | Good 98.1% |
| Apache | 73.2 /100 | #149 | Good 98.1% |
| Jordanians | 72.9 /100 | #150 | Good 98.1% |
| Soviet Union | 71.6 /100 | #151 | Good 98.0% |
| Dutch West Indians | 70.2 /100 | #152 | Good 98.0% |
| Immigrants | Moldova | 69.6 /100 | #153 | Good 98.0% |
| Immigrants | Iran | 68.7 /100 | #154 | Good 98.0% |
| Immigrants | South Central Asia | 66.7 /100 | #155 | Good 98.0% |
| Venezuelans | 66.6 /100 | #156 | Good 98.0% |
| Comanche | 66.0 /100 | #157 | Good 98.0% |
| Immigrants | North Macedonia | 65.7 /100 | #158 | Good 98.0% |
| French American Indians | 62.1 /100 | #159 | Good 98.0% |
| Immigrants | Russia | 59.9 /100 | #160 | Average 98.0% |
| Immigrants | Eastern Europe | 59.7 /100 | #161 | Average 98.0% |