Arab vs Immigrants from Iran Nursery School
COMPARE
Arab
Immigrants from Iran
Nursery School
Nursery School Comparison
Arabs
Immigrants from Iran
97.9%
NURSERY SCHOOL
34.7/ 100
METRIC RATING
188th/ 347
METRIC RANK
98.0%
NURSERY SCHOOL
68.7/ 100
METRIC RATING
154th/ 347
METRIC RANK
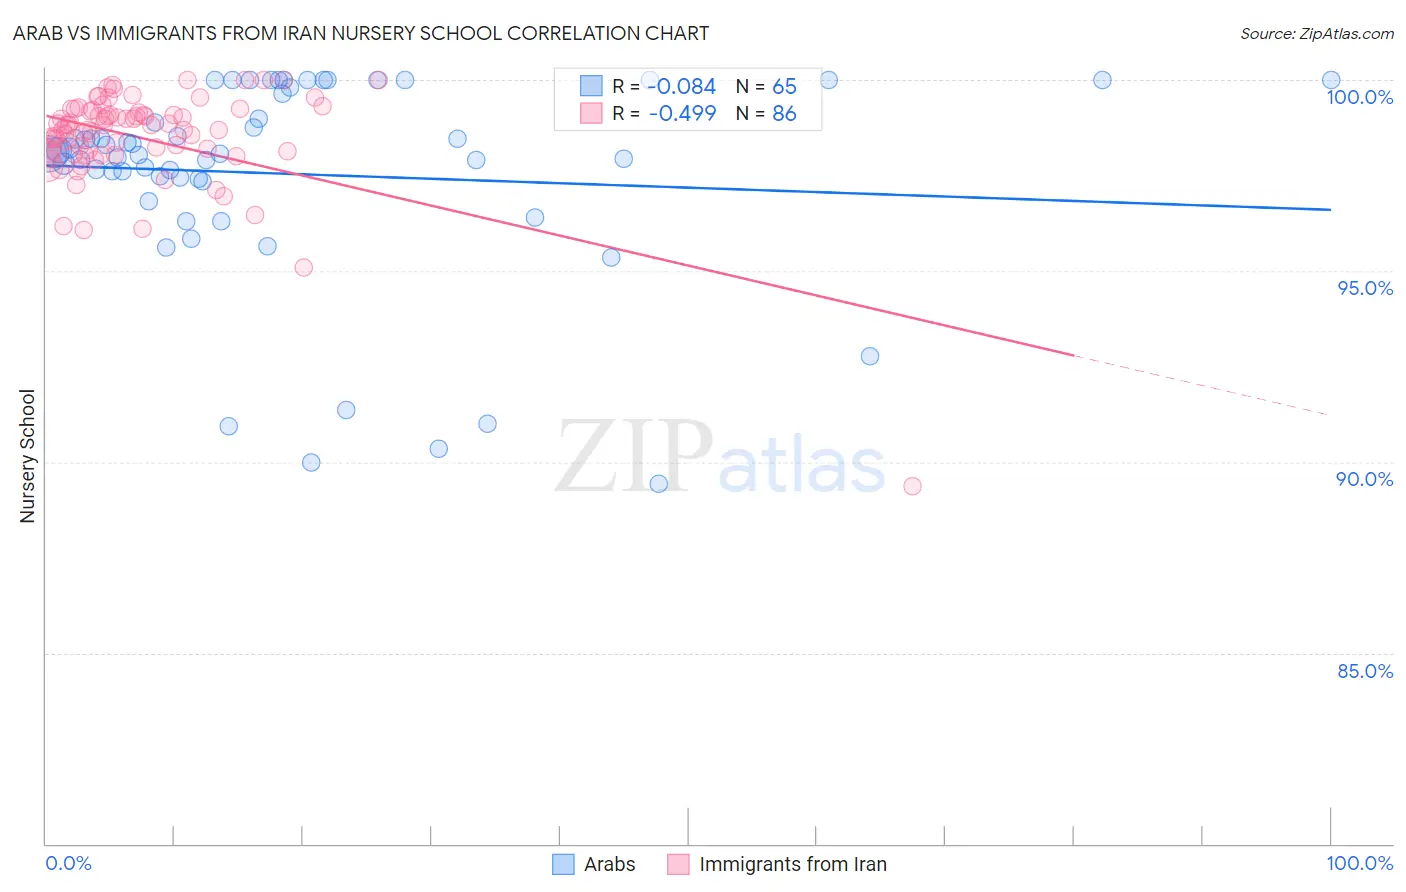
Arab vs Immigrants from Iran Nursery School Correlation Chart
The statistical analysis conducted on geographies consisting of 486,872,066 people shows a slight negative correlation between the proportion of Arabs and percentage of population with at least nursery school education in the United States with a correlation coefficient (R) of -0.084 and weighted average of 97.9%. Similarly, the statistical analysis conducted on geographies consisting of 279,886,762 people shows a moderate negative correlation between the proportion of Immigrants from Iran and percentage of population with at least nursery school education in the United States with a correlation coefficient (R) of -0.499 and weighted average of 98.0%, a difference of 0.11%.
Nursery School Correlation Summary
| Measurement | Arab | Immigrants from Iran |
| Minimum | 89.4% | 89.4% |
| Maximum | 100.0% | 100.0% |
| Range | 10.6% | 10.6% |
| Mean | 97.5% | 98.5% |
| Median | 98.1% | 98.8% |
| Interquartile 25% (IQ1) | 97.4% | 98.1% |
| Interquartile 75% (IQ3) | 99.7% | 99.2% |
| Interquartile Range (IQR) | 2.3% | 1.1% |
| Standard Deviation (Sample) | 2.7% | 1.4% |
| Standard Deviation (Population) | 2.7% | 1.4% |
Similar Demographics by Nursery School
Demographics Similar to Arabs by Nursery School
In terms of nursery school, the demographic groups most similar to Arabs are Pakistani (97.9%, a difference of 0.0%), Panamanian (97.9%, a difference of 0.0%), Immigrants from Kazakhstan (97.9%, a difference of 0.010%), Immigrants from Taiwan (97.9%, a difference of 0.010%), and Paiute (98.0%, a difference of 0.020%).
| Demographics | Rating | Rank | Nursery School |
| Egyptians | 42.8 /100 | #181 | Average 98.0% |
| Paiute | 42.0 /100 | #182 | Average 98.0% |
| Portuguese | 41.8 /100 | #183 | Average 98.0% |
| Immigrants | Poland | 41.3 /100 | #184 | Average 98.0% |
| Immigrants | Belarus | 41.0 /100 | #185 | Average 98.0% |
| Immigrants | Argentina | 40.8 /100 | #186 | Average 98.0% |
| Immigrants | Kazakhstan | 37.1 /100 | #187 | Fair 97.9% |
| Arabs | 34.7 /100 | #188 | Fair 97.9% |
| Pakistanis | 34.6 /100 | #189 | Fair 97.9% |
| Panamanians | 34.3 /100 | #190 | Fair 97.9% |
| Immigrants | Taiwan | 30.6 /100 | #191 | Fair 97.9% |
| Blacks/African Americans | 29.4 /100 | #192 | Fair 97.9% |
| Paraguayans | 27.4 /100 | #193 | Fair 97.9% |
| Mongolians | 27.3 /100 | #194 | Fair 97.9% |
| Hawaiians | 27.2 /100 | #195 | Fair 97.9% |
Demographics Similar to Immigrants from Iran by Nursery School
In terms of nursery school, the demographic groups most similar to Immigrants from Iran are Immigrants from Moldova (98.0%, a difference of 0.0%), Soviet Union (98.0%, a difference of 0.010%), Dutch West Indian (98.0%, a difference of 0.010%), Immigrants from South Central Asia (98.0%, a difference of 0.010%), and Venezuelan (98.0%, a difference of 0.010%).
| Demographics | Rating | Rank | Nursery School |
| Hmong | 75.7 /100 | #147 | Good 98.1% |
| Immigrants | Greece | 75.4 /100 | #148 | Good 98.1% |
| Apache | 73.2 /100 | #149 | Good 98.1% |
| Jordanians | 72.9 /100 | #150 | Good 98.1% |
| Soviet Union | 71.6 /100 | #151 | Good 98.0% |
| Dutch West Indians | 70.2 /100 | #152 | Good 98.0% |
| Immigrants | Moldova | 69.6 /100 | #153 | Good 98.0% |
| Immigrants | Iran | 68.7 /100 | #154 | Good 98.0% |
| Immigrants | South Central Asia | 66.7 /100 | #155 | Good 98.0% |
| Venezuelans | 66.6 /100 | #156 | Good 98.0% |
| Comanche | 66.0 /100 | #157 | Good 98.0% |
| Immigrants | North Macedonia | 65.7 /100 | #158 | Good 98.0% |
| French American Indians | 62.1 /100 | #159 | Good 98.0% |
| Immigrants | Russia | 59.9 /100 | #160 | Average 98.0% |
| Immigrants | Eastern Europe | 59.7 /100 | #161 | Average 98.0% |