Immigrants from France vs Immigrants from Iran Nursery School
COMPARE
Immigrants from France
Immigrants from Iran
Nursery School
Nursery School Comparison
Immigrants from France
Immigrants from Iran
98.2%
NURSERY SCHOOL
95.6/ 100
METRIC RATING
117th/ 347
METRIC RANK
98.0%
NURSERY SCHOOL
68.7/ 100
METRIC RATING
154th/ 347
METRIC RANK
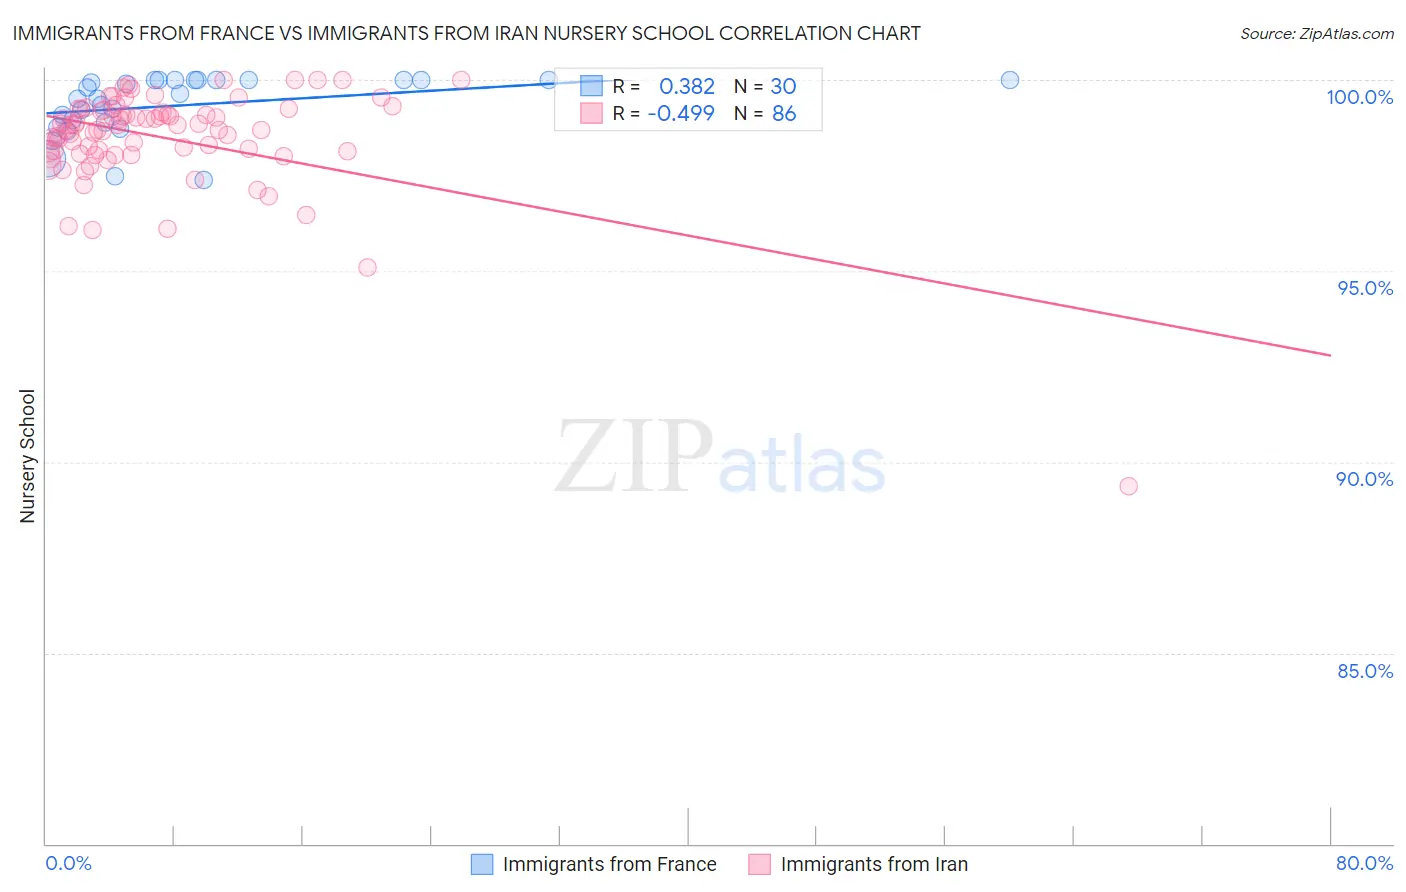
Immigrants from France vs Immigrants from Iran Nursery School Correlation Chart
The statistical analysis conducted on geographies consisting of 287,920,814 people shows a mild positive correlation between the proportion of Immigrants from France and percentage of population with at least nursery school education in the United States with a correlation coefficient (R) of 0.382 and weighted average of 98.2%. Similarly, the statistical analysis conducted on geographies consisting of 279,886,762 people shows a moderate negative correlation between the proportion of Immigrants from Iran and percentage of population with at least nursery school education in the United States with a correlation coefficient (R) of -0.499 and weighted average of 98.0%, a difference of 0.17%.
Nursery School Correlation Summary
| Measurement | Immigrants from France | Immigrants from Iran |
| Minimum | 97.4% | 89.4% |
| Maximum | 100.0% | 100.0% |
| Range | 2.6% | 10.6% |
| Mean | 99.3% | 98.5% |
| Median | 99.6% | 98.8% |
| Interquartile 25% (IQ1) | 98.9% | 98.1% |
| Interquartile 75% (IQ3) | 100.0% | 99.2% |
| Interquartile Range (IQR) | 1.1% | 1.1% |
| Standard Deviation (Sample) | 0.78% | 1.4% |
| Standard Deviation (Population) | 0.77% | 1.4% |
Similar Demographics by Nursery School
Demographics Similar to Immigrants from France by Nursery School
In terms of nursery school, the demographic groups most similar to Immigrants from France are Spanish (98.2%, a difference of 0.0%), Yugoslavian (98.2%, a difference of 0.0%), Ute (98.2%, a difference of 0.010%), Iranian (98.2%, a difference of 0.010%), and Thai (98.2%, a difference of 0.010%).
| Demographics | Rating | Rank | Nursery School |
| Immigrants | Singapore | 96.9 /100 | #110 | Exceptional 98.2% |
| Immigrants | Czechoslovakia | 96.8 /100 | #111 | Exceptional 98.2% |
| Immigrants | Norway | 96.6 /100 | #112 | Exceptional 98.2% |
| Immigrants | Latvia | 96.4 /100 | #113 | Exceptional 98.2% |
| Ute | 96.4 /100 | #114 | Exceptional 98.2% |
| Iranians | 96.3 /100 | #115 | Exceptional 98.2% |
| Spanish | 95.8 /100 | #116 | Exceptional 98.2% |
| Immigrants | France | 95.6 /100 | #117 | Exceptional 98.2% |
| Yugoslavians | 95.4 /100 | #118 | Exceptional 98.2% |
| Thais | 95.0 /100 | #119 | Exceptional 98.2% |
| Okinawans | 94.5 /100 | #120 | Exceptional 98.2% |
| Immigrants | Zimbabwe | 94.2 /100 | #121 | Exceptional 98.2% |
| Immigrants | Japan | 94.0 /100 | #122 | Exceptional 98.2% |
| Syrians | 93.9 /100 | #123 | Exceptional 98.2% |
| Lebanese | 93.8 /100 | #124 | Exceptional 98.2% |
Demographics Similar to Immigrants from Iran by Nursery School
In terms of nursery school, the demographic groups most similar to Immigrants from Iran are Immigrants from Moldova (98.0%, a difference of 0.0%), Soviet Union (98.0%, a difference of 0.010%), Dutch West Indian (98.0%, a difference of 0.010%), Immigrants from South Central Asia (98.0%, a difference of 0.010%), and Venezuelan (98.0%, a difference of 0.010%).
| Demographics | Rating | Rank | Nursery School |
| Hmong | 75.7 /100 | #147 | Good 98.1% |
| Immigrants | Greece | 75.4 /100 | #148 | Good 98.1% |
| Apache | 73.2 /100 | #149 | Good 98.1% |
| Jordanians | 72.9 /100 | #150 | Good 98.1% |
| Soviet Union | 71.6 /100 | #151 | Good 98.0% |
| Dutch West Indians | 70.2 /100 | #152 | Good 98.0% |
| Immigrants | Moldova | 69.6 /100 | #153 | Good 98.0% |
| Immigrants | Iran | 68.7 /100 | #154 | Good 98.0% |
| Immigrants | South Central Asia | 66.7 /100 | #155 | Good 98.0% |
| Venezuelans | 66.6 /100 | #156 | Good 98.0% |
| Comanche | 66.0 /100 | #157 | Good 98.0% |
| Immigrants | North Macedonia | 65.7 /100 | #158 | Good 98.0% |
| French American Indians | 62.1 /100 | #159 | Good 98.0% |
| Immigrants | Russia | 59.9 /100 | #160 | Average 98.0% |
| Immigrants | Eastern Europe | 59.7 /100 | #161 | Average 98.0% |