Soviet Union Nursery School

COMPARE

Soviet Union
Race
Ancestry
AfghanAfricanAlaska NativeAlaskan AthabascanAlbanianAleutAlsatianAmericanApacheArabArapahoArgentineanArmenianAssyrian/Chaldean/SyriacAustralianAustrianBahamianBangladeshiBarbadianBasqueBelgianBelizeanBermudanBhutaneseBlackfeetBolivianBrazilianBritishBritish West IndianBulgarianBurmeseCajunCambodianCanadianCape VerdeanCarpatho RusynCelticCentral AmericanCentral American IndianCherokeeCheyenneChickasawChileanChineseChippewaChoctawColombianColvilleComancheCosta RicanCreeCreekCroatianCrowCubanCypriotCzechCzechoslovakianDanishDelawareDominicanDutchDutch West IndianEastern EuropeanEcuadorianEgyptianEnglishEstonianEthiopianEuropeanFijianFilipinoFinnishFrenchFrench American IndianFrench CanadianGermanGerman RussianGhanaianGreekGuamanian/ChamorroGuatemalanGuyaneseHaitianHmongHonduranHopiHoumaHungarianIcelanderIndian (Asian)IndonesianInupiatIranianIraqiIrishIroquoisIsraeliItalianJamaicanJapaneseJordanianKenyanKiowaKoreanLaotianLatvianLebaneseLiberianLithuanianLumbeeLuxembourgerMacedonianMalaysianMalteseMarshalleseMenomineeMexicanMexican American IndianMongolianMoroccanNative HawaiianNavajoNepaleseNew ZealanderNicaraguanNigerianNorthern EuropeanNorwegianOkinawanOsageOttawaPaiutePakistaniPalestinianPanamanianParaguayanPennsylvania GermanPeruvianPimaPolishPortuguesePotawatomiPuebloPuerto RicanPuget Sound SalishRomanianRussianSalvadoranSamoanScandinavianScotch-IrishScottishSeminoleSenegaleseSerbianShoshoneSierra LeoneanSiouxSlavicSlovakSloveneSomaliSouth AfricanSouth AmericanSouth American IndianSoviet UnionSpaniardSpanishSpanish AmericanSpanish American IndianSri LankanSubsaharan AfricanSudaneseSwedishSwissSyrianTaiwaneseThaiTlingit-HaidaTohono O'OdhamTonganTrinidadian and TobagonianTsimshianTurkishU.S. Virgin IslanderUgandanUkrainianUruguayanUteVenezuelanVietnameseWelshWest IndianYakamaYaquiYugoslavianYumanYup'ikZimbabwean
Immigration
NonimmigrantsImmigrantsAfghanistanAfricaAlbaniaArgentinaArmeniaAsiaAustraliaAustriaBahamasBangladeshBarbadosBelarusBelgiumBelizeBoliviaBosnia and HerzegovinaBrazilBulgariaBurma/MyanmarCabo VerdeCambodiaCameroonCanadaCaribbeanCentral AmericaChileChinaColombiaCongoCosta RicaCroatiaCubaCzechoslovakiaDenmarkDominicaDominican RepublicEastern AfricaEastern AsiaEastern EuropeEcuadorEgyptEl SalvadorEnglandEritreaEthiopiaEuropeFijiFranceGermanyGhanaGreeceGrenadaGuatemalaGuyanaHaitiHondurasHong KongHungaryIndiaIndonesiaIranIraqIrelandIsraelItalyJamaicaJapanJordanKazakhstanKenyaKoreaKuwaitLaosLatin AmericaLatviaLebanonLiberiaLithuaniaMalaysiaMexicoMicronesiaMiddle AfricaMoldovaMoroccoNepalNetherlandsNicaraguaNigeriaNorth AmericaNorth MacedoniaNorthern AfricaNorthern EuropeNorwayOceaniaPakistanPanamaPeruPhilippinesPolandPortugalRomaniaRussiaSaudi ArabiaScotlandSenegalSerbiaSierra LeoneSingaporeSomaliaSouth AfricaSouth AmericaSouth Central AsiaSouth Eastern AsiaSouthern EuropeSpainSri LankaSt. Vincent and the GrenadinesSudanSwedenSwitzerlandSyriaTaiwanThailandTrinidad and TobagoTurkeyUgandaUkraineUruguayUzbekistanVenezuelaVietnamWest IndiesWestern AfricaWestern AsiaWestern EuropeYemenZaireZimbabweAzores
Select to Compare
Race
Ancestry
AfghanAfricanAlaska NativeAlaskan AthabascanAlbanianAleutAlsatianAmericanApacheArabArapahoArgentineanArmenianAssyrian/Chaldean/SyriacAustralianAustrianBahamianBangladeshiBarbadianBasqueBelgianBelizeanBermudanBhutaneseBlackfeetBolivianBrazilianBritishBritish West IndianBulgarianBurmeseCajunCambodianCanadianCape VerdeanCarpatho RusynCelticCentral AmericanCentral American IndianCherokeeCheyenneChickasawChileanChineseChippewaChoctawColombianColvilleComancheCosta RicanCreeCreekCroatianCrowCubanCypriotCzechCzechoslovakianDanishDelawareDominicanDutchDutch West IndianEastern EuropeanEcuadorianEgyptianEnglishEstonianEthiopianEuropeanFijianFilipinoFinnishFrenchFrench American IndianFrench CanadianGermanGerman RussianGhanaianGreekGuamanian/ChamorroGuatemalanGuyaneseHaitianHmongHonduranHopiHoumaHungarianIcelanderIndian (Asian)IndonesianInupiatIranianIraqiIrishIroquoisIsraeliItalianJamaicanJapaneseJordanianKenyanKiowaKoreanLaotianLatvianLebaneseLiberianLithuanianLumbeeLuxembourgerMacedonianMalaysianMalteseMarshalleseMenomineeMexicanMexican American IndianMongolianMoroccanNative HawaiianNavajoNepaleseNew ZealanderNicaraguanNigerianNorthern EuropeanNorwegianOkinawanOsageOttawaPaiutePakistaniPalestinianPanamanianParaguayanPennsylvania GermanPeruvianPimaPolishPortuguesePotawatomiPuebloPuerto RicanPuget Sound SalishRomanianRussianSalvadoranSamoanScandinavianScotch-IrishScottishSeminoleSenegaleseSerbianShoshoneSierra LeoneanSiouxSlavicSlovakSloveneSomaliSouth AfricanSouth AmericanSouth American IndianSpaniardSpanishSpanish AmericanSpanish American IndianSri LankanSubsaharan AfricanSudaneseSwedishSwissSyrianTaiwaneseThaiTlingit-HaidaTohono O'OdhamTonganTrinidadian and TobagonianTsimshianTurkishU.S. Virgin IslanderUgandanUkrainianUruguayanUteVenezuelanVietnameseWelshWest IndianYakamaYaquiYugoslavianYumanYup'ikZimbabwean
Immigration
NonimmigrantsImmigrantsAfghanistanAfricaAlbaniaArgentinaArmeniaAsiaAustraliaAustriaBahamasBangladeshBarbadosBelarusBelgiumBelizeBoliviaBosnia and HerzegovinaBrazilBulgariaBurma/MyanmarCabo VerdeCambodiaCameroonCanadaCaribbeanCentral AmericaChileChinaColombiaCongoCosta RicaCroatiaCubaCzechoslovakiaDenmarkDominicaDominican RepublicEastern AfricaEastern AsiaEastern EuropeEcuadorEgyptEl SalvadorEnglandEritreaEthiopiaEuropeFijiFranceGermanyGhanaGreeceGrenadaGuatemalaGuyanaHaitiHondurasHong KongHungaryIndiaIndonesiaIranIraqIrelandIsraelItalyJamaicaJapanJordanKazakhstanKenyaKoreaKuwaitLaosLatin AmericaLatviaLebanonLiberiaLithuaniaMalaysiaMexicoMicronesiaMiddle AfricaMoldovaMoroccoNepalNetherlandsNicaraguaNigeriaNorth AmericaNorth MacedoniaNorthern AfricaNorthern EuropeNorwayOceaniaPakistanPanamaPeruPhilippinesPolandPortugalRomaniaRussiaSaudi ArabiaScotlandSenegalSerbiaSierra LeoneSingaporeSomaliaSouth AfricaSouth AmericaSouth Central AsiaSouth Eastern AsiaSouthern EuropeSpainSri LankaSt. Vincent and the GrenadinesSudanSwedenSwitzerlandSyriaTaiwanThailandTrinidad and TobagoTurkeyUgandaUkraineUruguayUzbekistanVenezuelaVietnamWest IndiesWestern AfricaWestern AsiaWestern EuropeYemenZaireZimbabweAzores
Nursery School
Income
Poverty
Unemployment
Labor Participation
Family Structure
Vehicle Availability
Education Level
Disability

Soviet Union Nursery School
Good

98.0%
NURSERY SCHOOL
71.6/ 100
METRIC RATING
151st/ 347
METRIC RANK

Soviet Union Nursery School Correlation Chart

The statistical analysis conducted on geographies consisting of 43,454,395 people shows a moderate positive correlation between the proportion of Soviet Union and percentage of population with at least nursery school education in the United States with a correlation coefficient (R) of 0.408 and weighted average of 98.0%. On average, for every 1% (one percent) increase in Soviet Union within a typical geography, there is an increase of 1.1% in percentage of population with at least nursery school education.
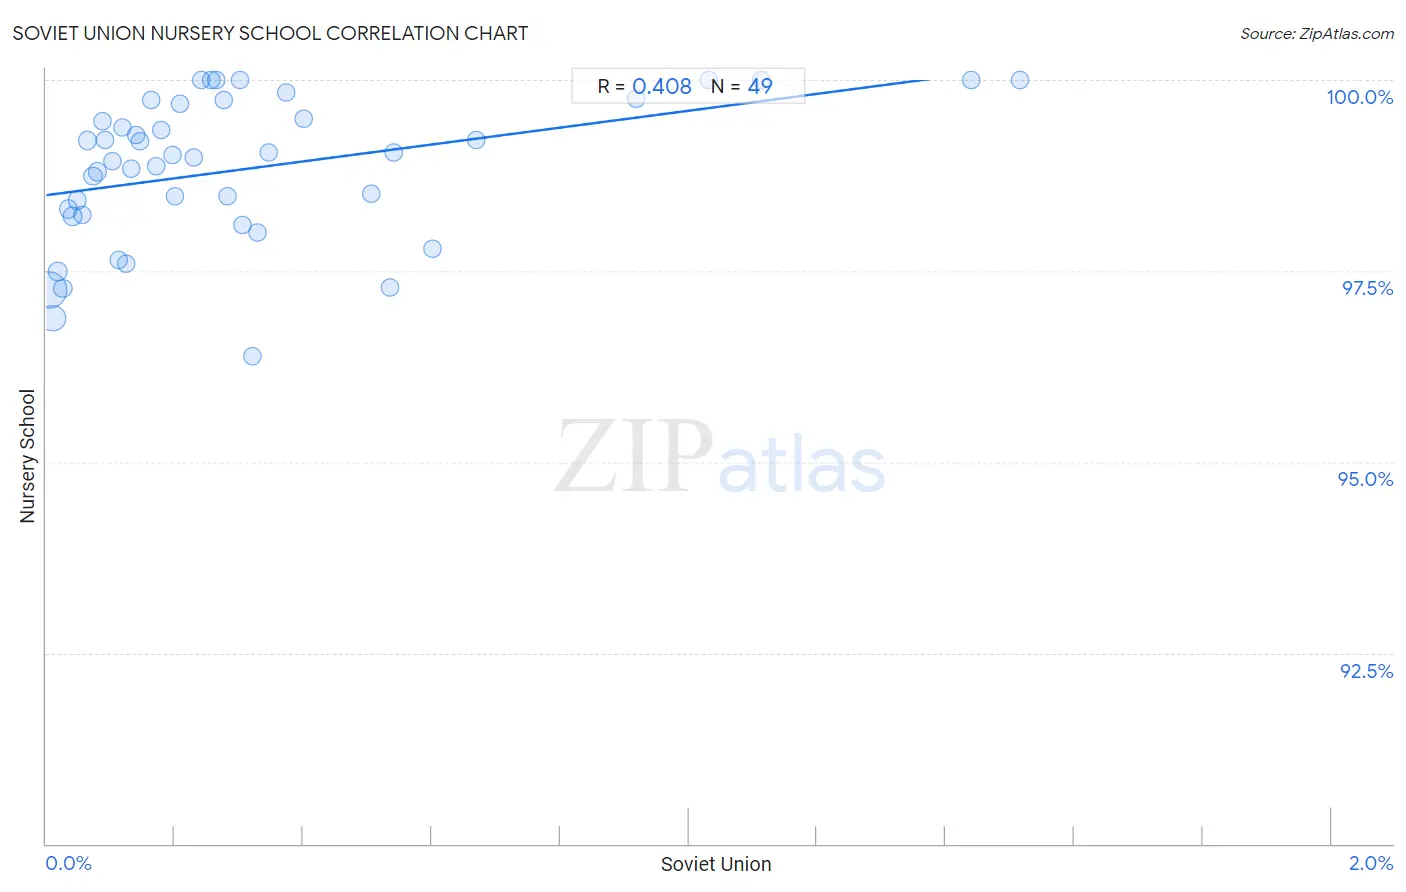
Soviet Union Nursery School
It is essential to understand that the correlation between the percentage of Soviet Union and percentage of population with at least nursery school education does not imply a direct cause-and-effect relationship. It remains uncertain whether the presence of Soviet Union influences an upward or downward trend in the level of percentage of population with at least nursery school education within an area, or if Soviet Union simply ended up residing in those areas with higher or lower levels of percentage of population with at least nursery school education due to other factors.

Demographics Similar to Soviet Union by Nursery School

In terms of nursery school, the demographic groups most similar to Soviet Union are Jordanian (98.1%, a difference of 0.0%), Immigrants from Greece (98.1%, a difference of 0.010%), Apache (98.1%, a difference of 0.010%), Dutch West Indian (98.0%, a difference of 0.010%), and Immigrants from Moldova (98.0%, a difference of 0.010%).
DemographicsRating | RankNursery School
Alsatians
80.3
/100
|
#144
Excellent
98.1%
Immigrants from Israel
78.5
/100
|
#145
Good
98.1%
Filipinos
78.5
/100
|
#146
Good
98.1%
Hmong
75.7
/100
|
#147
Good
98.1%
Immigrants from Greece
75.4
/100
|
#148
Good
98.1%
Apache
73.2
/100
|
#149
Good
98.1%
Jordanians
72.9
/100
|
#150
Good
98.1%
Soviet Union
71.6
/100
|
#151
Good
98.0%
Dutch West Indians
70.2
/100
|
#152
Good
98.0%
Immigrants from Moldova
69.6
/100
|
#153
Good
98.0%
Immigrants from Iran
68.7
/100
|
#154
Good
98.0%
Immigrants from South Central Asia
66.7
/100
|
#155
Good
98.0%
Venezuelans
66.6
/100
|
#156
Good
98.0%
Comanche
66.0
/100
|
#157
Good
98.0%
Immigrants from North Macedonia
65.7
/100
|
#158
Good
98.0%

Soviet Union Nursery School Correlation Summary

Measurement Soviet Union Data Nursery School Data
Minimum 0.0032% 96.4%
Maximum 1.5% 100.0%
Range 1.5% 3.6%
Mean 0.31% 98.8%
Median 0.20% 99.0%
Interquartile 25% (IQ1) 0.090% 98.2%
Interquartile 75% (IQ3) 0.36% 99.7%
Interquartile Range (IQR) 0.27% 1.5%
Standard Deviation (Sample) 0.35% 0.95%
Standard Deviation (Population) 0.35% 0.94%

Correlation Details

Soviet Union Percentile Sample Size Nursery School
[
0.0%
-
0.5%
]
0.0032%
24,703,913 97.3%
[
0.0%
-
0.5%
]
0.0095%
11,258,323 96.9%
[
0.0%
-
0.5%
]
0.018%
1,054,867 97.5%
[
0.0%
-
0.5%
]
0.026%
864,752 97.3%
[
0.0%
-
0.5%
]
0.034%
932,942 98.3%
[
0.0%
-
0.5%
]
0.040%
1,513,924 98.2%
[
0.0%
-
0.5%
]
0.049%
675,377 98.4%
[
0.0%
-
0.5%
]
0.056%
355,817 98.2%
[
0.0%
-
0.5%
]
0.064%
277,085 99.2%
[
0.0%
-
0.5%
]
0.073%
255,733 98.7%
[
0.0%
-
0.5%
]
0.080%
327,945 98.8%
[
0.0%
-
0.5%
]
0.088%
27,211 99.5%
[
0.0%
-
0.5%
]
0.092%
41,440 99.2%
[
0.0%
-
0.5%
]
0.10%
156,090 98.9%
[
0.0%
-
0.5%
]
0.11%
95,613 97.6%
[
0.0%
-
0.5%
]
0.12%
72,834 99.4%
[
0.0%
-
0.5%
]
0.12%
104,995 97.6%
[
0.0%
-
0.5%
]
0.13%
112,905 98.8%
[
0.0%
-
0.5%
]
0.14%
34,048 99.3%
[
0.0%
-
0.5%
]
0.15%
71,909 99.2%
[
0.0%
-
0.5%
]
0.16%
2,453 99.7%
[
0.0%
-
0.5%
]
0.17%
123,337 98.9%
[
0.0%
-
0.5%
]
0.18%
6,127 99.4%
[
0.0%
-
0.5%
]
0.20%
32,537 99.0%
[
0.0%
-
0.5%
]
0.20%
7,979 98.5%
[
0.0%
-
0.5%
]
0.21%
22,630 99.7%
[
0.0%
-
0.5%
]
0.23%
23,445 99.0%
[
0.0%
-
0.5%
]
0.24%
9,156 100.0%
[
0.0%
-
0.5%
]
0.26%
6,625 100.0%
[
0.0%
-
0.5%
]
0.26%
2,653 100.0%
[
0.0%
-
0.5%
]
0.28%
6,517 99.7%
[
0.0%
-
0.5%
]
0.28%
10,302 98.5%
[
0.0%
-
0.5%
]
0.30%
8,943 100.0%
[
0.0%
-
0.5%
]
0.31%
27,171 98.1%
[
0.0%
-
0.5%
]
0.32%
81,109 96.4%
[
0.0%
-
0.5%
]
0.33%
20,411 98.0%
[
0.0%
-
0.5%
]
0.35%
4,041 99.0%
[
0.0%
-
0.5%
]
0.37%
5,897 99.8%
[
0.0%
-
0.5%
]
0.40%
9,975 99.5%
[
0.5%
-
1.0%
]
0.51%
8,298 98.5%
[
0.5%
-
1.0%
]
0.54%
15,497 97.3%
[
0.5%
-
1.0%
]
0.54%
27,514 99.1%
[
0.5%
-
1.0%
]
0.60%
16,808 97.8%
[
0.5%
-
1.0%
]
0.67%
26,565 99.2%
[
0.5%
-
1.0%
]
0.92%
2,067 99.8%
[
1.0%
-
1.5%
]
1.03%
7,086 100.0%
[
1.0%
-
1.5%
]
1.11%
1,258 100.0%
[
1.0%
-
1.5%
]
1.44%
139 100.0%
[
1.5%
-
2.0%
]
1.52%
132 100.0%