Immigrants vs Immigrants from Ecuador Nursery School
COMPARE
Immigrants
Immigrants from Ecuador
Nursery School
Nursery School Comparison
Immigrants
Immigrants from Ecuador
97.2%
NURSERY SCHOOL
0.0/ 100
METRIC RATING
295th/ 347
METRIC RANK
96.9%
NURSERY SCHOOL
0.0/ 100
METRIC RATING
317th/ 347
METRIC RANK
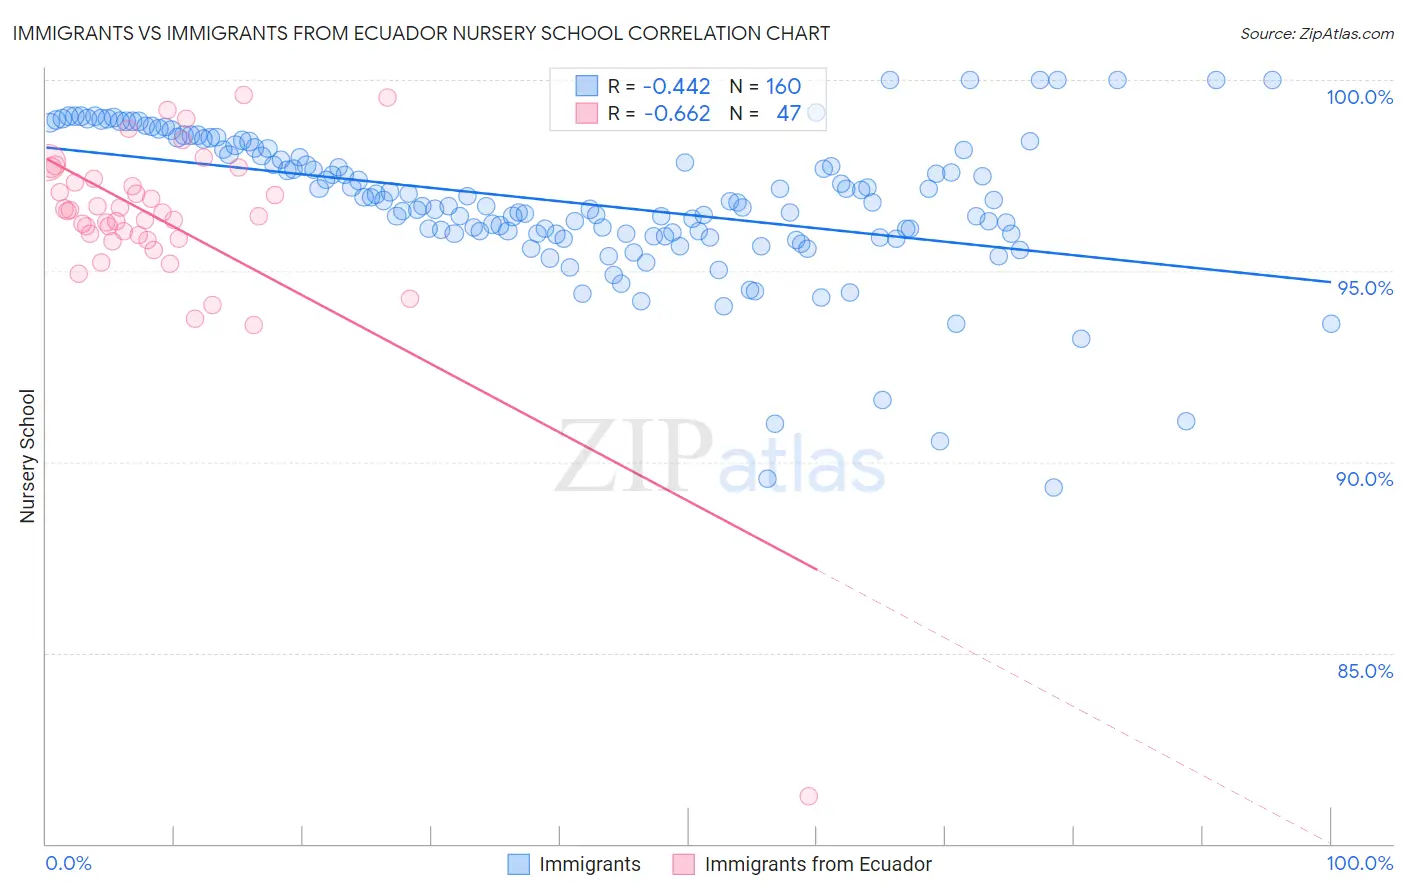
Immigrants vs Immigrants from Ecuador Nursery School Correlation Chart
The statistical analysis conducted on geographies consisting of 577,788,049 people shows a moderate negative correlation between the proportion of Immigrants and percentage of population with at least nursery school education in the United States with a correlation coefficient (R) of -0.442 and weighted average of 97.2%. Similarly, the statistical analysis conducted on geographies consisting of 271,020,679 people shows a significant negative correlation between the proportion of Immigrants from Ecuador and percentage of population with at least nursery school education in the United States with a correlation coefficient (R) of -0.662 and weighted average of 96.9%, a difference of 0.32%.
Nursery School Correlation Summary
| Measurement | Immigrants | Immigrants from Ecuador |
| Minimum | 89.3% | 81.2% |
| Maximum | 100.0% | 99.6% |
| Range | 10.7% | 18.3% |
| Mean | 96.8% | 96.3% |
| Median | 96.8% | 96.5% |
| Interquartile 25% (IQ1) | 96.0% | 95.8% |
| Interquartile 75% (IQ3) | 98.2% | 97.4% |
| Interquartile Range (IQR) | 2.2% | 1.6% |
| Standard Deviation (Sample) | 1.9% | 2.6% |
| Standard Deviation (Population) | 1.9% | 2.6% |
Similar Demographics by Nursery School
Demographics Similar to Immigrants by Nursery School
In terms of nursery school, the demographic groups most similar to Immigrants are Immigrants from Grenada (97.3%, a difference of 0.010%), Immigrants from Eritrea (97.2%, a difference of 0.010%), Malaysian (97.3%, a difference of 0.020%), Houma (97.3%, a difference of 0.030%), and British West Indian (97.3%, a difference of 0.050%).
| Demographics | Rating | Rank | Nursery School |
| Immigrants | Thailand | 0.0 /100 | #288 | Tragic 97.3% |
| Immigrants | St. Vincent and the Grenadines | 0.0 /100 | #289 | Tragic 97.3% |
| Immigrants | Afghanistan | 0.0 /100 | #290 | Tragic 97.3% |
| British West Indians | 0.0 /100 | #291 | Tragic 97.3% |
| Houma | 0.0 /100 | #292 | Tragic 97.3% |
| Malaysians | 0.0 /100 | #293 | Tragic 97.3% |
| Immigrants | Grenada | 0.0 /100 | #294 | Tragic 97.3% |
| Immigrants | Immigrants | 0.0 /100 | #295 | Tragic 97.2% |
| Immigrants | Eritrea | 0.0 /100 | #296 | Tragic 97.2% |
| Immigrants | Cuba | 0.0 /100 | #297 | Tragic 97.2% |
| Central American Indians | 0.0 /100 | #298 | Tragic 97.2% |
| Immigrants | Dominica | 0.0 /100 | #299 | Tragic 97.2% |
| Haitians | 0.0 /100 | #300 | Tragic 97.2% |
| Immigrants | South Eastern Asia | 0.0 /100 | #301 | Tragic 97.1% |
| Immigrants | Caribbean | 0.0 /100 | #302 | Tragic 97.1% |
Demographics Similar to Immigrants from Ecuador by Nursery School
In terms of nursery school, the demographic groups most similar to Immigrants from Ecuador are Cape Verdean (97.0%, a difference of 0.010%), Immigrants from Nicaragua (96.9%, a difference of 0.010%), Immigrants from Belize (96.9%, a difference of 0.010%), Honduran (97.0%, a difference of 0.020%), and Immigrants from Guyana (96.9%, a difference of 0.040%).
| Demographics | Rating | Rank | Nursery School |
| Guyanese | 0.0 /100 | #310 | Tragic 97.0% |
| Immigrants | Azores | 0.0 /100 | #311 | Tragic 97.0% |
| Sri Lankans | 0.0 /100 | #312 | Tragic 97.0% |
| Hondurans | 0.0 /100 | #313 | Tragic 97.0% |
| Cape Verdeans | 0.0 /100 | #314 | Tragic 97.0% |
| Immigrants | Nicaragua | 0.0 /100 | #315 | Tragic 96.9% |
| Immigrants | Belize | 0.0 /100 | #316 | Tragic 96.9% |
| Immigrants | Ecuador | 0.0 /100 | #317 | Tragic 96.9% |
| Immigrants | Guyana | 0.0 /100 | #318 | Tragic 96.9% |
| Immigrants | Laos | 0.0 /100 | #319 | Tragic 96.9% |
| Immigrants | Burma/Myanmar | 0.0 /100 | #320 | Tragic 96.9% |
| Immigrants | Bangladesh | 0.0 /100 | #321 | Tragic 96.9% |
| Mexican American Indians | 0.0 /100 | #322 | Tragic 96.9% |
| Immigrants | Honduras | 0.0 /100 | #323 | Tragic 96.9% |
| Vietnamese | 0.0 /100 | #324 | Tragic 96.8% |