Immigrants from Zaire vs Immigrants from Eastern Europe GED/Equivalency
COMPARE
Immigrants from Zaire
Immigrants from Eastern Europe
GED/Equivalency
GED/Equivalency Comparison
Immigrants from Zaire
Immigrants from Eastern Europe
84.5%
GED/EQUIVALENCY
5.5/ 100
METRIC RATING
226th/ 347
METRIC RANK
87.1%
GED/EQUIVALENCY
95.5/ 100
METRIC RATING
109th/ 347
METRIC RANK
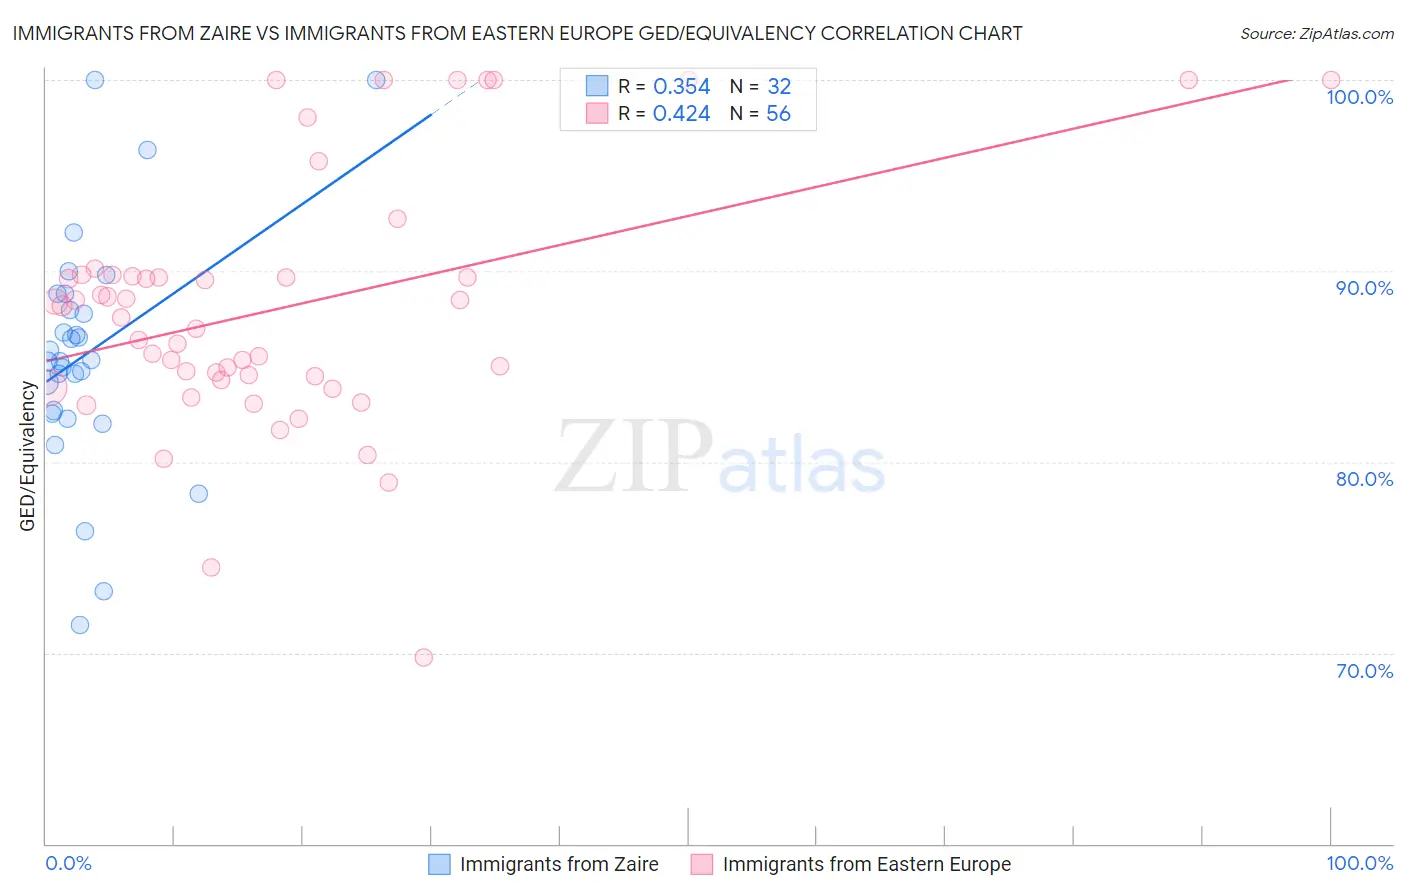
Immigrants from Zaire vs Immigrants from Eastern Europe GED/Equivalency Correlation Chart
The statistical analysis conducted on geographies consisting of 107,255,805 people shows a mild positive correlation between the proportion of Immigrants from Zaire and percentage of population with at least ged/equivalency education in the United States with a correlation coefficient (R) of 0.354 and weighted average of 84.5%. Similarly, the statistical analysis conducted on geographies consisting of 475,879,420 people shows a moderate positive correlation between the proportion of Immigrants from Eastern Europe and percentage of population with at least ged/equivalency education in the United States with a correlation coefficient (R) of 0.424 and weighted average of 87.1%, a difference of 3.1%.
GED/Equivalency Correlation Summary
| Measurement | Immigrants from Zaire | Immigrants from Eastern Europe |
| Minimum | 71.4% | 69.7% |
| Maximum | 100.0% | 100.0% |
| Range | 28.6% | 30.3% |
| Mean | 85.7% | 88.1% |
| Median | 85.3% | 87.9% |
| Interquartile 25% (IQ1) | 82.6% | 84.4% |
| Interquartile 75% (IQ3) | 88.4% | 89.7% |
| Interquartile Range (IQR) | 5.8% | 5.4% |
| Standard Deviation (Sample) | 6.2% | 6.6% |
| Standard Deviation (Population) | 6.1% | 6.5% |
Similar Demographics by GED/Equivalency
Demographics Similar to Immigrants from Zaire by GED/Equivalency
In terms of ged/equivalency, the demographic groups most similar to Immigrants from Zaire are Immigrants from Costa Rica (84.5%, a difference of 0.010%), Immigrants from Thailand (84.5%, a difference of 0.020%), Immigrants from Liberia (84.4%, a difference of 0.070%), French American Indian (84.6%, a difference of 0.080%), and Immigrants from Uruguay (84.4%, a difference of 0.10%).
| Demographics | Rating | Rank | GED/Equivalency |
| Potawatomi | 8.2 /100 | #219 | Tragic 84.7% |
| Americans | 8.2 /100 | #220 | Tragic 84.7% |
| Taiwanese | 8.1 /100 | #221 | Tragic 84.7% |
| Iroquois | 7.5 /100 | #222 | Tragic 84.6% |
| Immigrants | Uzbekistan | 7.1 /100 | #223 | Tragic 84.6% |
| French American Indians | 6.3 /100 | #224 | Tragic 84.6% |
| Immigrants | Thailand | 5.8 /100 | #225 | Tragic 84.5% |
| Immigrants | Zaire | 5.5 /100 | #226 | Tragic 84.5% |
| Immigrants | Costa Rica | 5.4 /100 | #227 | Tragic 84.5% |
| Immigrants | Liberia | 4.9 /100 | #228 | Tragic 84.4% |
| Immigrants | Uruguay | 4.6 /100 | #229 | Tragic 84.4% |
| Immigrants | Colombia | 4.5 /100 | #230 | Tragic 84.4% |
| Immigrants | Middle Africa | 4.3 /100 | #231 | Tragic 84.4% |
| Immigrants | South America | 4.2 /100 | #232 | Tragic 84.4% |
| Immigrants | Panama | 4.1 /100 | #233 | Tragic 84.4% |
Demographics Similar to Immigrants from Eastern Europe by GED/Equivalency
In terms of ged/equivalency, the demographic groups most similar to Immigrants from Eastern Europe are Canadian (87.1%, a difference of 0.010%), Icelander (87.1%, a difference of 0.030%), Egyptian (87.1%, a difference of 0.030%), French (87.1%, a difference of 0.030%), and Immigrants from Zimbabwe (87.1%, a difference of 0.040%).
| Demographics | Rating | Rank | GED/Equivalency |
| Lebanese | 96.2 /100 | #102 | Exceptional 87.2% |
| Jordanians | 96.1 /100 | #103 | Exceptional 87.2% |
| Immigrants | Hungary | 96.0 /100 | #104 | Exceptional 87.2% |
| Indians (Asian) | 95.9 /100 | #105 | Exceptional 87.1% |
| Immigrants | Zimbabwe | 95.8 /100 | #106 | Exceptional 87.1% |
| Icelanders | 95.7 /100 | #107 | Exceptional 87.1% |
| Canadians | 95.6 /100 | #108 | Exceptional 87.1% |
| Immigrants | Eastern Europe | 95.5 /100 | #109 | Exceptional 87.1% |
| Egyptians | 95.3 /100 | #110 | Exceptional 87.1% |
| French | 95.2 /100 | #111 | Exceptional 87.1% |
| Tlingit-Haida | 94.8 /100 | #112 | Exceptional 87.0% |
| Assyrians/Chaldeans/Syriacs | 94.8 /100 | #113 | Exceptional 87.0% |
| Immigrants | Kazakhstan | 94.7 /100 | #114 | Exceptional 87.0% |
| Mongolians | 94.6 /100 | #115 | Exceptional 87.0% |
| Swiss | 94.5 /100 | #116 | Exceptional 87.0% |