Immigrants from Zaire vs Immigrants from Eastern Asia GED/Equivalency
COMPARE
Immigrants from Zaire
Immigrants from Eastern Asia
GED/Equivalency
GED/Equivalency Comparison
Immigrants from Zaire
Immigrants from Eastern Asia
84.5%
GED/EQUIVALENCY
5.5/ 100
METRIC RATING
226th/ 347
METRIC RANK
87.4%
GED/EQUIVALENCY
97.9/ 100
METRIC RATING
91st/ 347
METRIC RANK
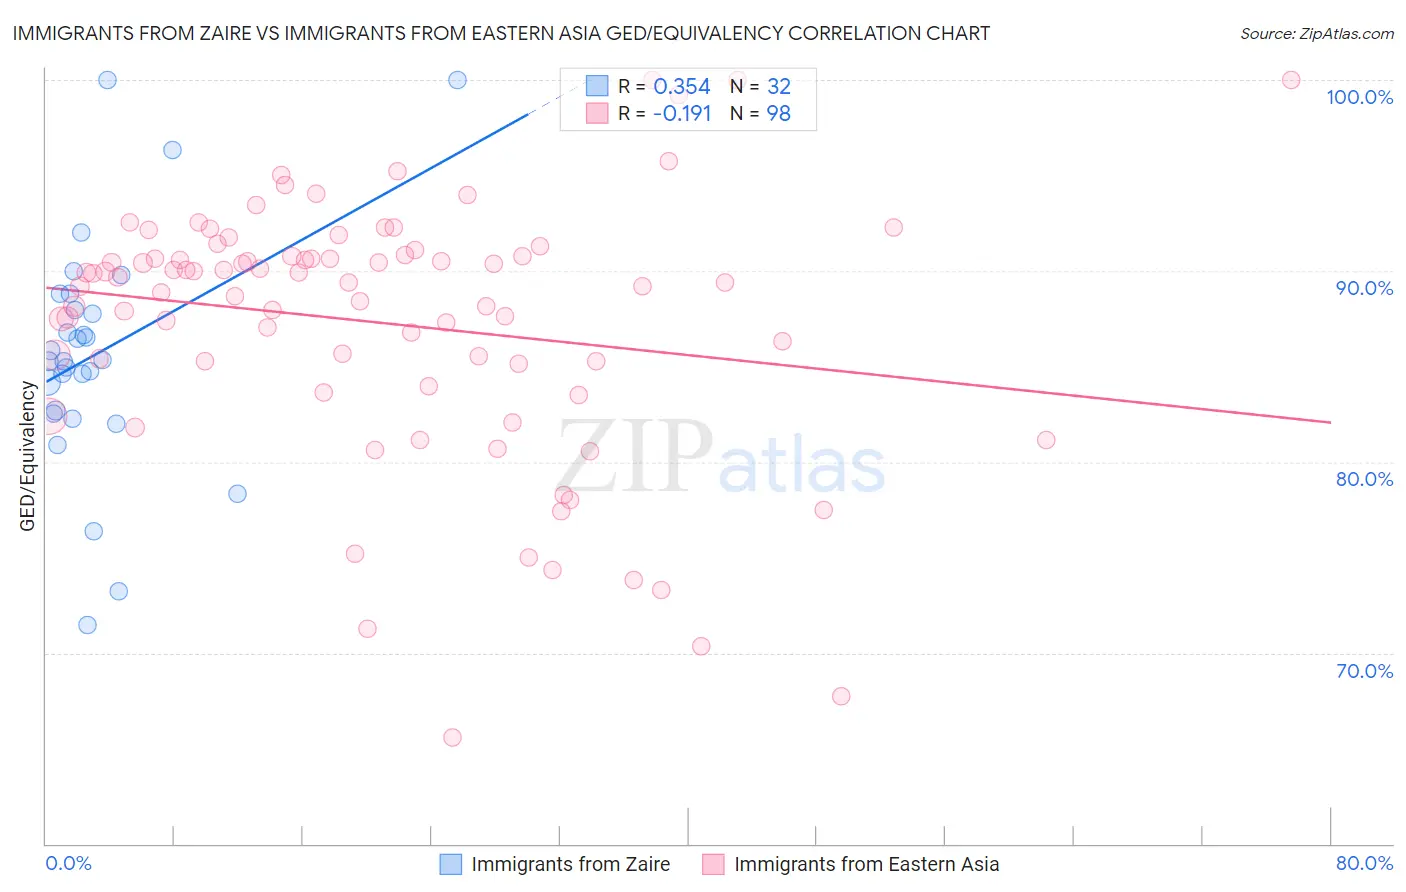
Immigrants from Zaire vs Immigrants from Eastern Asia GED/Equivalency Correlation Chart
The statistical analysis conducted on geographies consisting of 107,255,805 people shows a mild positive correlation between the proportion of Immigrants from Zaire and percentage of population with at least ged/equivalency education in the United States with a correlation coefficient (R) of 0.354 and weighted average of 84.5%. Similarly, the statistical analysis conducted on geographies consisting of 499,846,164 people shows a poor negative correlation between the proportion of Immigrants from Eastern Asia and percentage of population with at least ged/equivalency education in the United States with a correlation coefficient (R) of -0.191 and weighted average of 87.4%, a difference of 3.5%.
GED/Equivalency Correlation Summary
| Measurement | Immigrants from Zaire | Immigrants from Eastern Asia |
| Minimum | 71.4% | 65.6% |
| Maximum | 100.0% | 100.0% |
| Range | 28.6% | 34.4% |
| Mean | 85.7% | 87.3% |
| Median | 85.3% | 89.4% |
| Interquartile 25% (IQ1) | 82.6% | 85.1% |
| Interquartile 75% (IQ3) | 88.4% | 90.8% |
| Interquartile Range (IQR) | 5.8% | 5.6% |
| Standard Deviation (Sample) | 6.2% | 6.8% |
| Standard Deviation (Population) | 6.1% | 6.8% |
Similar Demographics by GED/Equivalency
Demographics Similar to Immigrants from Zaire by GED/Equivalency
In terms of ged/equivalency, the demographic groups most similar to Immigrants from Zaire are Immigrants from Costa Rica (84.5%, a difference of 0.010%), Immigrants from Thailand (84.5%, a difference of 0.020%), Immigrants from Liberia (84.4%, a difference of 0.070%), French American Indian (84.6%, a difference of 0.080%), and Immigrants from Uruguay (84.4%, a difference of 0.10%).
| Demographics | Rating | Rank | GED/Equivalency |
| Potawatomi | 8.2 /100 | #219 | Tragic 84.7% |
| Americans | 8.2 /100 | #220 | Tragic 84.7% |
| Taiwanese | 8.1 /100 | #221 | Tragic 84.7% |
| Iroquois | 7.5 /100 | #222 | Tragic 84.6% |
| Immigrants | Uzbekistan | 7.1 /100 | #223 | Tragic 84.6% |
| French American Indians | 6.3 /100 | #224 | Tragic 84.6% |
| Immigrants | Thailand | 5.8 /100 | #225 | Tragic 84.5% |
| Immigrants | Zaire | 5.5 /100 | #226 | Tragic 84.5% |
| Immigrants | Costa Rica | 5.4 /100 | #227 | Tragic 84.5% |
| Immigrants | Liberia | 4.9 /100 | #228 | Tragic 84.4% |
| Immigrants | Uruguay | 4.6 /100 | #229 | Tragic 84.4% |
| Immigrants | Colombia | 4.5 /100 | #230 | Tragic 84.4% |
| Immigrants | Middle Africa | 4.3 /100 | #231 | Tragic 84.4% |
| Immigrants | South America | 4.2 /100 | #232 | Tragic 84.4% |
| Immigrants | Panama | 4.1 /100 | #233 | Tragic 84.4% |
Demographics Similar to Immigrants from Eastern Asia by GED/Equivalency
In terms of ged/equivalency, the demographic groups most similar to Immigrants from Eastern Asia are Hungarian (87.4%, a difference of 0.010%), Welsh (87.4%, a difference of 0.010%), Israeli (87.4%, a difference of 0.010%), Immigrants from North Macedonia (87.4%, a difference of 0.020%), and Immigrants from Russia (87.4%, a difference of 0.020%).
| Demographics | Rating | Rank | GED/Equivalency |
| Immigrants | Romania | 98.1 /100 | #84 | Exceptional 87.5% |
| Dutch | 98.1 /100 | #85 | Exceptional 87.5% |
| Immigrants | Europe | 98.1 /100 | #86 | Exceptional 87.5% |
| Native Hawaiians | 98.1 /100 | #87 | Exceptional 87.5% |
| Immigrants | Norway | 98.1 /100 | #88 | Exceptional 87.5% |
| Hungarians | 97.9 /100 | #89 | Exceptional 87.4% |
| Welsh | 97.9 /100 | #90 | Exceptional 87.4% |
| Immigrants | Eastern Asia | 97.9 /100 | #91 | Exceptional 87.4% |
| Israelis | 97.8 /100 | #92 | Exceptional 87.4% |
| Immigrants | North Macedonia | 97.8 /100 | #93 | Exceptional 87.4% |
| Immigrants | Russia | 97.8 /100 | #94 | Exceptional 87.4% |
| Immigrants | Greece | 97.7 /100 | #95 | Exceptional 87.4% |
| Czechoslovakians | 97.6 /100 | #96 | Exceptional 87.4% |
| Immigrants | Western Europe | 97.3 /100 | #97 | Exceptional 87.3% |
| Immigrants | Croatia | 96.9 /100 | #98 | Exceptional 87.3% |