Immigrants from North America vs Immigrants from Latin America GED/Equivalency
COMPARE
Immigrants from North America
Immigrants from Latin America
GED/Equivalency
GED/Equivalency Comparison
Immigrants from North America
Immigrants from Latin America
87.8%
GED/EQUIVALENCY
99.1/ 100
METRIC RATING
65th/ 347
METRIC RANK
78.5%
GED/EQUIVALENCY
0.0/ 100
METRIC RATING
335th/ 347
METRIC RANK
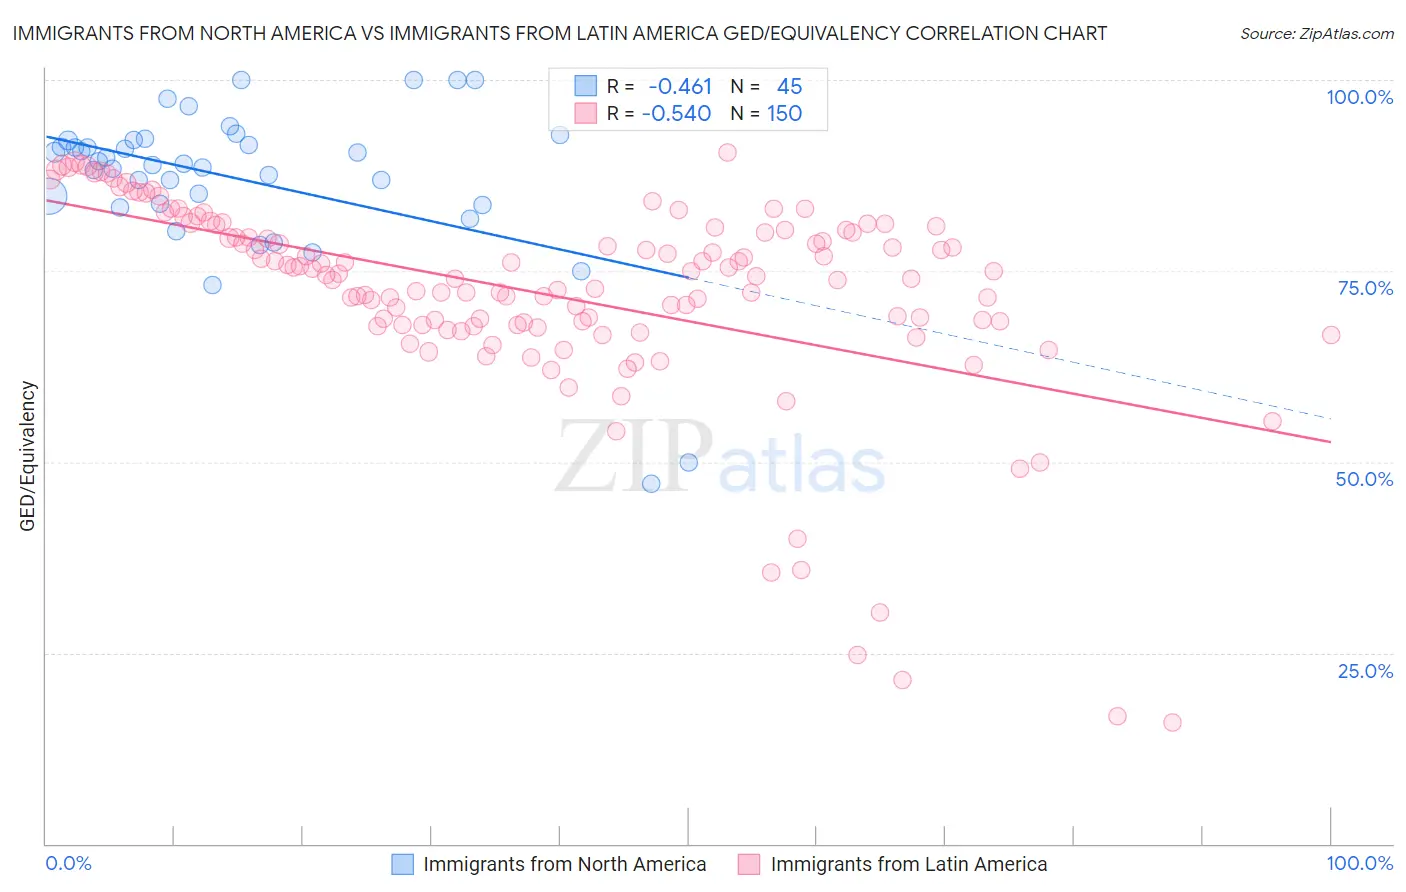
Immigrants from North America vs Immigrants from Latin America GED/Equivalency Correlation Chart
The statistical analysis conducted on geographies consisting of 462,461,910 people shows a moderate negative correlation between the proportion of Immigrants from North America and percentage of population with at least ged/equivalency education in the United States with a correlation coefficient (R) of -0.461 and weighted average of 87.8%. Similarly, the statistical analysis conducted on geographies consisting of 558,649,843 people shows a substantial negative correlation between the proportion of Immigrants from Latin America and percentage of population with at least ged/equivalency education in the United States with a correlation coefficient (R) of -0.540 and weighted average of 78.5%, a difference of 11.9%.
GED/Equivalency Correlation Summary
| Measurement | Immigrants from North America | Immigrants from Latin America |
| Minimum | 47.1% | 16.0% |
| Maximum | 100.0% | 90.5% |
| Range | 52.9% | 74.6% |
| Mean | 86.9% | 72.1% |
| Median | 89.0% | 74.6% |
| Interquartile 25% (IQ1) | 83.7% | 68.0% |
| Interquartile 75% (IQ3) | 92.1% | 80.4% |
| Interquartile Range (IQR) | 8.4% | 12.4% |
| Standard Deviation (Sample) | 10.5% | 13.6% |
| Standard Deviation (Population) | 10.4% | 13.5% |
Similar Demographics by GED/Equivalency
Demographics Similar to Immigrants from North America by GED/Equivalency
In terms of ged/equivalency, the demographic groups most similar to Immigrants from North America are Immigrants from Bulgaria (87.8%, a difference of 0.0%), British (87.8%, a difference of 0.010%), Immigrants from France (87.8%, a difference of 0.020%), Immigrants from Canada (87.9%, a difference of 0.030%), and Immigrants from Turkey (87.9%, a difference of 0.070%).
| Demographics | Rating | Rank | GED/Equivalency |
| Northern Europeans | 99.3 /100 | #58 | Exceptional 87.9% |
| Serbians | 99.3 /100 | #59 | Exceptional 87.9% |
| Scandinavians | 99.3 /100 | #60 | Exceptional 87.9% |
| Europeans | 99.3 /100 | #61 | Exceptional 87.9% |
| Germans | 99.3 /100 | #62 | Exceptional 87.9% |
| Immigrants | Turkey | 99.2 /100 | #63 | Exceptional 87.9% |
| Immigrants | Canada | 99.2 /100 | #64 | Exceptional 87.9% |
| Immigrants | North America | 99.1 /100 | #65 | Exceptional 87.8% |
| Immigrants | Bulgaria | 99.1 /100 | #66 | Exceptional 87.8% |
| British | 99.1 /100 | #67 | Exceptional 87.8% |
| Immigrants | France | 99.1 /100 | #68 | Exceptional 87.8% |
| Immigrants | Saudi Arabia | 99.0 /100 | #69 | Exceptional 87.8% |
| Ukrainians | 98.8 /100 | #70 | Exceptional 87.7% |
| Austrians | 98.8 /100 | #71 | Exceptional 87.7% |
| Immigrants | Moldova | 98.8 /100 | #72 | Exceptional 87.7% |
Demographics Similar to Immigrants from Latin America by GED/Equivalency
In terms of ged/equivalency, the demographic groups most similar to Immigrants from Latin America are Guatemalan (78.5%, a difference of 0.020%), Salvadoran (78.6%, a difference of 0.11%), Immigrants from the Azores (78.7%, a difference of 0.22%), Immigrants from Honduras (78.7%, a difference of 0.33%), and Immigrants from Cabo Verde (78.9%, a difference of 0.58%).
| Demographics | Rating | Rank | GED/Equivalency |
| Hispanics or Latinos | 0.0 /100 | #328 | Tragic 79.1% |
| Dominicans | 0.0 /100 | #329 | Tragic 79.1% |
| Immigrants | Cabo Verde | 0.0 /100 | #330 | Tragic 78.9% |
| Immigrants | Honduras | 0.0 /100 | #331 | Tragic 78.7% |
| Immigrants | Azores | 0.0 /100 | #332 | Tragic 78.7% |
| Salvadorans | 0.0 /100 | #333 | Tragic 78.6% |
| Guatemalans | 0.0 /100 | #334 | Tragic 78.5% |
| Immigrants | Latin America | 0.0 /100 | #335 | Tragic 78.5% |
| Immigrants | Dominican Republic | 0.0 /100 | #336 | Tragic 78.0% |
| Immigrants | Yemen | 0.0 /100 | #337 | Tragic 77.9% |
| Immigrants | Guatemala | 0.0 /100 | #338 | Tragic 77.9% |
| Immigrants | El Salvador | 0.0 /100 | #339 | Tragic 77.6% |
| Tohono O'odham | 0.0 /100 | #340 | Tragic 77.5% |
| Mexicans | 0.0 /100 | #341 | Tragic 77.4% |
| Pima | 0.0 /100 | #342 | Tragic 76.4% |