Immigrants from Thailand vs Immigrants from Latin America GED/Equivalency
COMPARE
Immigrants from Thailand
Immigrants from Latin America
GED/Equivalency
GED/Equivalency Comparison
Immigrants from Thailand
Immigrants from Latin America
84.5%
GED/EQUIVALENCY
5.8/ 100
METRIC RATING
225th/ 347
METRIC RANK
78.5%
GED/EQUIVALENCY
0.0/ 100
METRIC RATING
335th/ 347
METRIC RANK
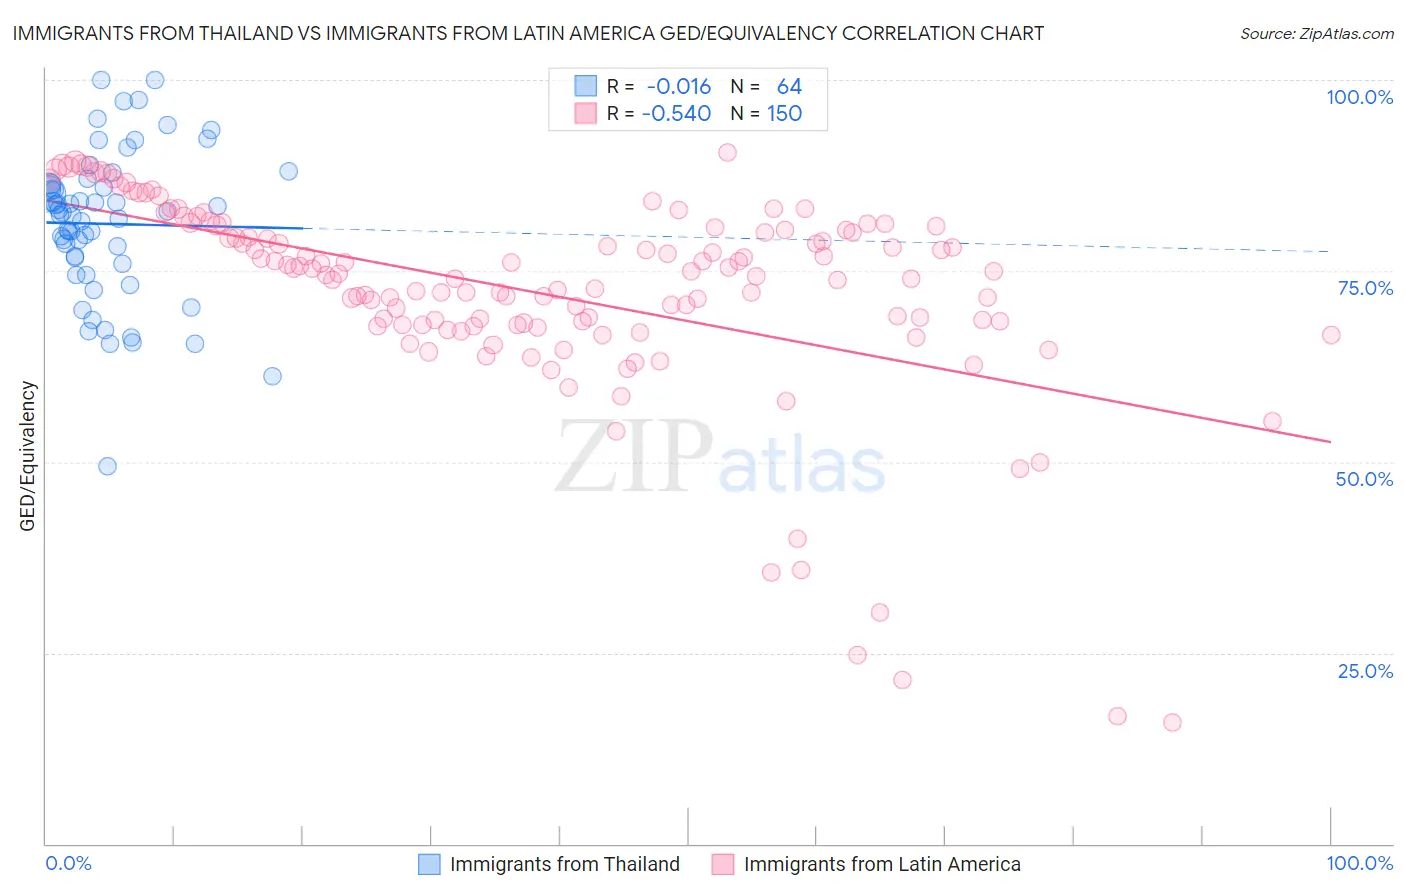
Immigrants from Thailand vs Immigrants from Latin America GED/Equivalency Correlation Chart
The statistical analysis conducted on geographies consisting of 317,022,868 people shows no correlation between the proportion of Immigrants from Thailand and percentage of population with at least ged/equivalency education in the United States with a correlation coefficient (R) of -0.016 and weighted average of 84.5%. Similarly, the statistical analysis conducted on geographies consisting of 558,649,843 people shows a substantial negative correlation between the proportion of Immigrants from Latin America and percentage of population with at least ged/equivalency education in the United States with a correlation coefficient (R) of -0.540 and weighted average of 78.5%, a difference of 7.7%.
GED/Equivalency Correlation Summary
| Measurement | Immigrants from Thailand | Immigrants from Latin America |
| Minimum | 49.4% | 16.0% |
| Maximum | 100.0% | 90.5% |
| Range | 50.6% | 74.6% |
| Mean | 81.2% | 72.1% |
| Median | 82.5% | 74.6% |
| Interquartile 25% (IQ1) | 76.4% | 68.0% |
| Interquartile 75% (IQ3) | 86.3% | 80.4% |
| Interquartile Range (IQR) | 10.0% | 12.4% |
| Standard Deviation (Sample) | 9.8% | 13.6% |
| Standard Deviation (Population) | 9.7% | 13.5% |
Similar Demographics by GED/Equivalency
Demographics Similar to Immigrants from Thailand by GED/Equivalency
In terms of ged/equivalency, the demographic groups most similar to Immigrants from Thailand are Immigrants from Zaire (84.5%, a difference of 0.020%), Immigrants from Costa Rica (84.5%, a difference of 0.040%), French American Indian (84.6%, a difference of 0.050%), Immigrants from Liberia (84.4%, a difference of 0.090%), and Immigrants from Uzbekistan (84.6%, a difference of 0.12%).
| Demographics | Rating | Rank | GED/Equivalency |
| Alaska Natives | 8.6 /100 | #218 | Tragic 84.7% |
| Potawatomi | 8.2 /100 | #219 | Tragic 84.7% |
| Americans | 8.2 /100 | #220 | Tragic 84.7% |
| Taiwanese | 8.1 /100 | #221 | Tragic 84.7% |
| Iroquois | 7.5 /100 | #222 | Tragic 84.6% |
| Immigrants | Uzbekistan | 7.1 /100 | #223 | Tragic 84.6% |
| French American Indians | 6.3 /100 | #224 | Tragic 84.6% |
| Immigrants | Thailand | 5.8 /100 | #225 | Tragic 84.5% |
| Immigrants | Zaire | 5.5 /100 | #226 | Tragic 84.5% |
| Immigrants | Costa Rica | 5.4 /100 | #227 | Tragic 84.5% |
| Immigrants | Liberia | 4.9 /100 | #228 | Tragic 84.4% |
| Immigrants | Uruguay | 4.6 /100 | #229 | Tragic 84.4% |
| Immigrants | Colombia | 4.5 /100 | #230 | Tragic 84.4% |
| Immigrants | Middle Africa | 4.3 /100 | #231 | Tragic 84.4% |
| Immigrants | South America | 4.2 /100 | #232 | Tragic 84.4% |
Demographics Similar to Immigrants from Latin America by GED/Equivalency
In terms of ged/equivalency, the demographic groups most similar to Immigrants from Latin America are Guatemalan (78.5%, a difference of 0.020%), Salvadoran (78.6%, a difference of 0.11%), Immigrants from the Azores (78.7%, a difference of 0.22%), Immigrants from Honduras (78.7%, a difference of 0.33%), and Immigrants from Cabo Verde (78.9%, a difference of 0.58%).
| Demographics | Rating | Rank | GED/Equivalency |
| Hispanics or Latinos | 0.0 /100 | #328 | Tragic 79.1% |
| Dominicans | 0.0 /100 | #329 | Tragic 79.1% |
| Immigrants | Cabo Verde | 0.0 /100 | #330 | Tragic 78.9% |
| Immigrants | Honduras | 0.0 /100 | #331 | Tragic 78.7% |
| Immigrants | Azores | 0.0 /100 | #332 | Tragic 78.7% |
| Salvadorans | 0.0 /100 | #333 | Tragic 78.6% |
| Guatemalans | 0.0 /100 | #334 | Tragic 78.5% |
| Immigrants | Latin America | 0.0 /100 | #335 | Tragic 78.5% |
| Immigrants | Dominican Republic | 0.0 /100 | #336 | Tragic 78.0% |
| Immigrants | Yemen | 0.0 /100 | #337 | Tragic 77.9% |
| Immigrants | Guatemala | 0.0 /100 | #338 | Tragic 77.9% |
| Immigrants | El Salvador | 0.0 /100 | #339 | Tragic 77.6% |
| Tohono O'odham | 0.0 /100 | #340 | Tragic 77.5% |
| Mexicans | 0.0 /100 | #341 | Tragic 77.4% |
| Pima | 0.0 /100 | #342 | Tragic 76.4% |