Immigrants from Western Asia vs Filipino Disability Age 18 to 34
COMPARE
Immigrants from Western Asia
Filipino
Disability Age 18 to 34
Disability Age 18 to 34 Comparison
Immigrants from Western Asia
Filipinos
6.1%
DISABILITY AGE 18 TO 34
98.9/ 100
METRIC RATING
76th/ 347
METRIC RANK
5.4%
DISABILITY AGE 18 TO 34
100.0/ 100
METRIC RATING
6th/ 347
METRIC RANK
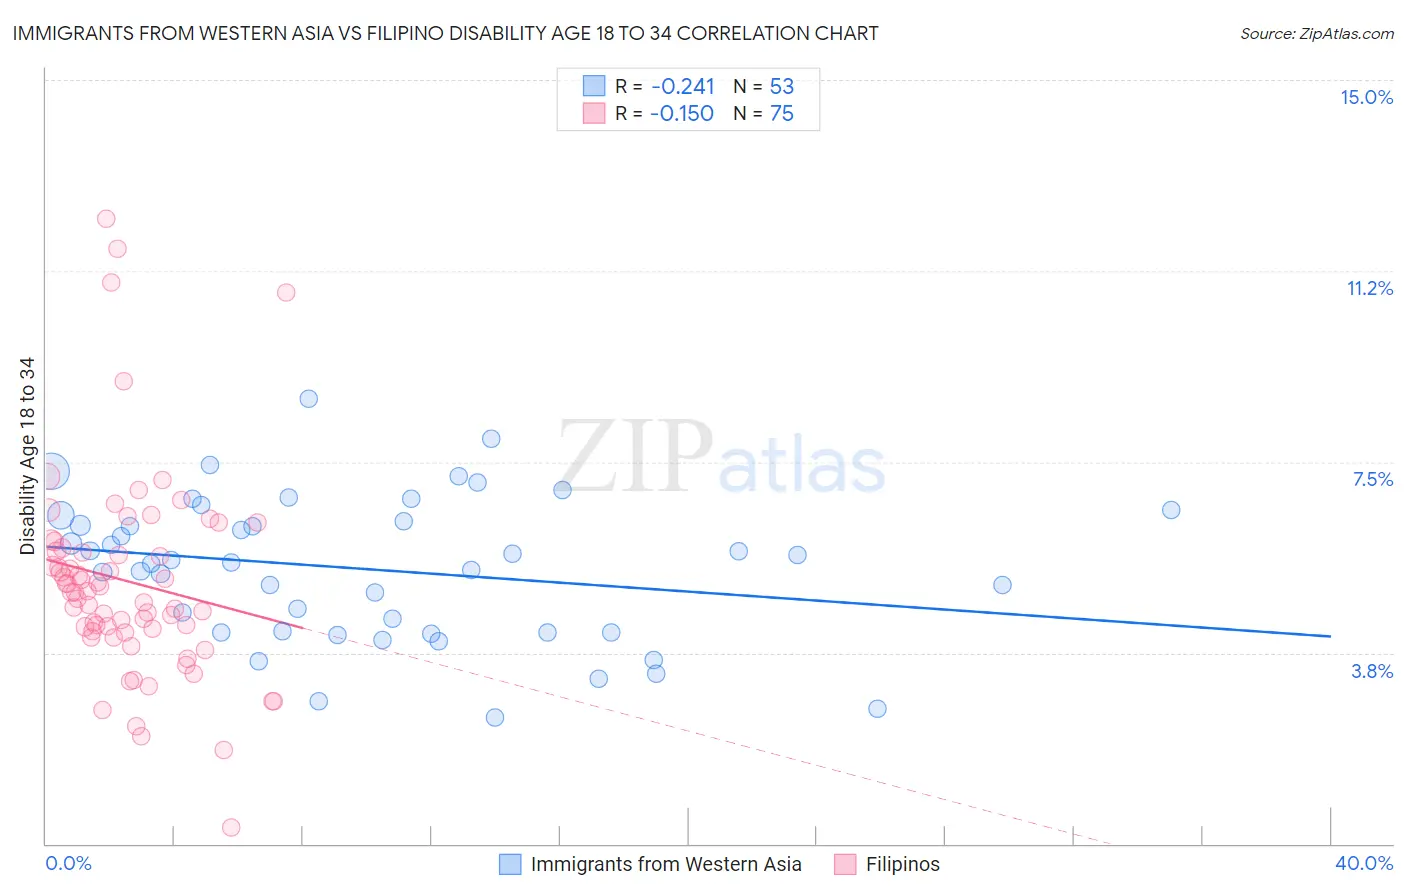
Immigrants from Western Asia vs Filipino Disability Age 18 to 34 Correlation Chart
The statistical analysis conducted on geographies consisting of 403,567,862 people shows a weak negative correlation between the proportion of Immigrants from Western Asia and percentage of population with a disability between the ages 18 and 35 in the United States with a correlation coefficient (R) of -0.241 and weighted average of 6.1%. Similarly, the statistical analysis conducted on geographies consisting of 253,991,143 people shows a poor negative correlation between the proportion of Filipinos and percentage of population with a disability between the ages 18 and 35 in the United States with a correlation coefficient (R) of -0.150 and weighted average of 5.4%, a difference of 11.7%.
Disability Age 18 to 34 Correlation Summary
| Measurement | Immigrants from Western Asia | Filipino |
| Minimum | 2.5% | 0.31% |
| Maximum | 8.7% | 12.3% |
| Range | 6.3% | 12.0% |
| Mean | 5.4% | 5.2% |
| Median | 5.5% | 4.9% |
| Interquartile 25% (IQ1) | 4.1% | 4.2% |
| Interquartile 75% (IQ3) | 6.4% | 5.8% |
| Interquartile Range (IQR) | 2.2% | 1.6% |
| Standard Deviation (Sample) | 1.4% | 2.0% |
| Standard Deviation (Population) | 1.4% | 2.0% |
Similar Demographics by Disability Age 18 to 34
Demographics Similar to Immigrants from Western Asia by Disability Age 18 to 34
In terms of disability age 18 to 34, the demographic groups most similar to Immigrants from Western Asia are Immigrants from Russia (6.1%, a difference of 0.10%), Assyrian/Chaldean/Syriac (6.1%, a difference of 0.10%), Immigrants from Turkey (6.1%, a difference of 0.28%), Afghan (6.1%, a difference of 0.40%), and Haitian (6.0%, a difference of 0.58%).
| Demographics | Rating | Rank | Disability Age 18 to 34 |
| Immigrants | West Indies | 99.4 /100 | #69 | Exceptional 6.0% |
| Immigrants | Greece | 99.4 /100 | #70 | Exceptional 6.0% |
| Immigrants | Japan | 99.3 /100 | #71 | Exceptional 6.0% |
| Immigrants | Lebanon | 99.2 /100 | #72 | Exceptional 6.0% |
| Cypriots | 99.2 /100 | #73 | Exceptional 6.0% |
| Haitians | 99.2 /100 | #74 | Exceptional 6.0% |
| Immigrants | Turkey | 99.1 /100 | #75 | Exceptional 6.1% |
| Immigrants | Western Asia | 98.9 /100 | #76 | Exceptional 6.1% |
| Immigrants | Russia | 98.9 /100 | #77 | Exceptional 6.1% |
| Assyrians/Chaldeans/Syriacs | 98.9 /100 | #78 | Exceptional 6.1% |
| Afghans | 98.7 /100 | #79 | Exceptional 6.1% |
| Immigrants | Chile | 98.5 /100 | #80 | Exceptional 6.1% |
| Immigrants | Australia | 98.5 /100 | #81 | Exceptional 6.1% |
| Immigrants | Northern Africa | 98.4 /100 | #82 | Exceptional 6.1% |
| Barbadians | 98.3 /100 | #83 | Exceptional 6.1% |
Demographics Similar to Filipinos by Disability Age 18 to 34
In terms of disability age 18 to 34, the demographic groups most similar to Filipinos are Immigrants from China (5.4%, a difference of 0.070%), Immigrants from Guyana (5.5%, a difference of 0.64%), Guyanese (5.5%, a difference of 1.1%), Immigrants from Taiwan (5.4%, a difference of 1.3%), and Immigrants from Uzbekistan (5.5%, a difference of 1.3%).
| Demographics | Rating | Rank | Disability Age 18 to 34 |
| Immigrants | Armenia | 100.0 /100 | #1 | Exceptional 5.0% |
| Immigrants | Hong Kong | 100.0 /100 | #2 | Exceptional 5.2% |
| Immigrants | Grenada | 100.0 /100 | #3 | Exceptional 5.3% |
| Immigrants | Cuba | 100.0 /100 | #4 | Exceptional 5.4% |
| Immigrants | Taiwan | 100.0 /100 | #5 | Exceptional 5.4% |
| Filipinos | 100.0 /100 | #6 | Exceptional 5.4% |
| Immigrants | China | 100.0 /100 | #7 | Exceptional 5.4% |
| Immigrants | Guyana | 100.0 /100 | #8 | Exceptional 5.5% |
| Guyanese | 100.0 /100 | #9 | Exceptional 5.5% |
| Immigrants | Uzbekistan | 100.0 /100 | #10 | Exceptional 5.5% |
| Vietnamese | 100.0 /100 | #11 | Exceptional 5.5% |
| Immigrants | St. Vincent and the Grenadines | 100.0 /100 | #12 | Exceptional 5.5% |
| Immigrants | Iran | 100.0 /100 | #13 | Exceptional 5.5% |
| Indians (Asian) | 100.0 /100 | #14 | Exceptional 5.5% |
| Immigrants | India | 100.0 /100 | #15 | Exceptional 5.6% |