Immigrants from Hungary vs Filipino GED/Equivalency

COMPARE

Immigrants from Hungary
Race
Ancestry
AfghanAfricanAlaska NativeAlaskan AthabascanAlbanianAleutAlsatianAmericanApacheArabArapahoArgentineanArmenianAssyrian/Chaldean/SyriacAustralianAustrianBahamianBangladeshiBarbadianBasqueBelgianBelizeanBermudanBhutaneseBlackfeetBolivianBrazilianBritishBritish West IndianBulgarianBurmeseCajunCambodianCanadianCape VerdeanCarpatho RusynCelticCentral AmericanCentral American IndianCherokeeCheyenneChickasawChileanChineseChippewaChoctawColombianColvilleComancheCosta RicanCreeCreekCroatianCrowCubanCypriotCzechCzechoslovakianDanishDelawareDominicanDutchDutch West IndianEastern EuropeanEcuadorianEgyptianEnglishEstonianEthiopianEuropeanFijianFinnishFrenchFrench American IndianFrench CanadianGermanGerman RussianGhanaianGreekGuamanian/ChamorroGuatemalanGuyaneseHaitianHmongHonduranHopiHoumaHungarianIcelanderIndian (Asian)IndonesianInupiatIranianIraqiIrishIroquoisIsraeliItalianJamaicanJapaneseJordanianKenyanKiowaKoreanLaotianLatvianLebaneseLiberianLithuanianLumbeeLuxembourgerMacedonianMalaysianMalteseMarshalleseMenomineeMexicanMexican American IndianMongolianMoroccanNative HawaiianNavajoNepaleseNew ZealanderNicaraguanNigerianNorthern EuropeanNorwegianOkinawanOsageOttawaPaiutePakistaniPalestinianPanamanianParaguayanPennsylvania GermanPeruvianPimaPolishPortuguesePotawatomiPuebloPuerto RicanPuget Sound SalishRomanianRussianSalvadoranSamoanScandinavianScotch-IrishScottishSeminoleSenegaleseSerbianShoshoneSierra LeoneanSiouxSlavicSlovakSloveneSomaliSouth AfricanSouth AmericanSouth American IndianSoviet UnionSpaniardSpanishSpanish AmericanSpanish American IndianSri LankanSubsaharan AfricanSudaneseSwedishSwissSyrianTaiwaneseThaiTlingit-HaidaTohono O'OdhamTonganTrinidadian and TobagonianTsimshianTurkishU.S. Virgin IslanderUgandanUkrainianUruguayanUteVenezuelanVietnameseWelshWest IndianYakamaYaquiYugoslavianYumanYup'ikZimbabwean
Immigration
NonimmigrantsImmigrantsAfghanistanAfricaAlbaniaArgentinaArmeniaAsiaAustraliaAustriaBahamasBangladeshBarbadosBelarusBelgiumBelizeBoliviaBosnia and HerzegovinaBrazilBulgariaBurma/MyanmarCabo VerdeCambodiaCameroonCanadaCaribbeanCentral AmericaChileChinaColombiaCongoCosta RicaCroatiaCubaCzechoslovakiaDenmarkDominicaDominican RepublicEastern AfricaEastern AsiaEastern EuropeEcuadorEgyptEl SalvadorEnglandEritreaEthiopiaEuropeFijiFranceGermanyGhanaGreeceGrenadaGuatemalaGuyanaHaitiHondurasHong KongHungaryIndiaIndonesiaIranIraqIrelandIsraelItalyJamaicaJapanJordanKazakhstanKenyaKoreaKuwaitLaosLatin AmericaLatviaLebanonLiberiaLithuaniaMalaysiaMexicoMicronesiaMiddle AfricaMoldovaMoroccoNepalNetherlandsNicaraguaNigeriaNorth AmericaNorth MacedoniaNorthern AfricaNorthern EuropeNorwayOceaniaPakistanPanamaPeruPhilippinesPolandPortugalRomaniaRussiaSaudi ArabiaScotlandSenegalSerbiaSierra LeoneSingaporeSomaliaSouth AfricaSouth AmericaSouth Central AsiaSouth Eastern AsiaSouthern EuropeSpainSri LankaSt. Vincent and the GrenadinesSudanSwedenSwitzerlandSyriaTaiwanThailandTrinidad and TobagoTurkeyUgandaUkraineUruguayUzbekistanVenezuelaVietnamWest IndiesWestern AfricaWestern AsiaWestern EuropeYemenZaireZimbabweAzores
Filipino
Race
Ancestry
AfghanAfricanAlaska NativeAlaskan AthabascanAlbanianAleutAlsatianAmericanApacheArabArapahoArgentineanArmenianAssyrian/Chaldean/SyriacAustralianAustrianBahamianBangladeshiBarbadianBasqueBelgianBelizeanBermudanBhutaneseBlackfeetBolivianBrazilianBritishBritish West IndianBulgarianBurmeseCajunCambodianCanadianCape VerdeanCarpatho RusynCelticCentral AmericanCentral American IndianCherokeeCheyenneChickasawChileanChineseChippewaChoctawColombianColvilleComancheCosta RicanCreeCreekCroatianCrowCubanCypriotCzechCzechoslovakianDanishDelawareDominicanDutchDutch West IndianEastern EuropeanEcuadorianEgyptianEnglishEstonianEthiopianEuropeanFijianFilipinoFinnishFrenchFrench American IndianFrench CanadianGermanGerman RussianGhanaianGreekGuamanian/ChamorroGuatemalanGuyaneseHaitianHmongHonduranHopiHoumaHungarianIcelanderIndian (Asian)IndonesianInupiatIranianIraqiIrishIroquoisIsraeliItalianJamaicanJapaneseJordanianKenyanKiowaKoreanLaotianLatvianLebaneseLiberianLithuanianLumbeeLuxembourgerMacedonianMalaysianMalteseMarshalleseMenomineeMexicanMexican American IndianMongolianMoroccanNative HawaiianNavajoNepaleseNew ZealanderNicaraguanNigerianNorthern EuropeanNorwegianOkinawanOsageOttawaPaiutePakistaniPalestinianPanamanianParaguayanPennsylvania GermanPeruvianPimaPolishPortuguesePotawatomiPuebloPuerto RicanPuget Sound SalishRomanianRussianSalvadoranSamoanScandinavianScotch-IrishScottishSeminoleSenegaleseSerbianShoshoneSierra LeoneanSiouxSlavicSlovakSloveneSomaliSouth AfricanSouth AmericanSouth American IndianSoviet UnionSpaniardSpanishSpanish AmericanSpanish American IndianSri LankanSubsaharan AfricanSudaneseSwedishSwissSyrianTaiwaneseThaiTlingit-HaidaTohono O'OdhamTonganTrinidadian and TobagonianTsimshianTurkishU.S. Virgin IslanderUgandanUkrainianUruguayanUteVenezuelanVietnameseWelshWest IndianYakamaYaquiYugoslavianYumanYup'ikZimbabwean
Immigration
NonimmigrantsImmigrantsAfghanistanAfricaAlbaniaArgentinaArmeniaAsiaAustraliaAustriaBahamasBangladeshBarbadosBelarusBelgiumBelizeBoliviaBosnia and HerzegovinaBrazilBulgariaBurma/MyanmarCabo VerdeCambodiaCameroonCanadaCaribbeanCentral AmericaChileChinaColombiaCongoCosta RicaCroatiaCubaCzechoslovakiaDenmarkDominicaDominican RepublicEastern AfricaEastern AsiaEastern EuropeEcuadorEgyptEl SalvadorEnglandEritreaEthiopiaEuropeFijiFranceGermanyGhanaGreeceGrenadaGuatemalaGuyanaHaitiHondurasHong KongIndiaIndonesiaIranIraqIrelandIsraelItalyJamaicaJapanJordanKazakhstanKenyaKoreaKuwaitLaosLatin AmericaLatviaLebanonLiberiaLithuaniaMalaysiaMexicoMicronesiaMiddle AfricaMoldovaMoroccoNepalNetherlandsNicaraguaNigeriaNorth AmericaNorth MacedoniaNorthern AfricaNorthern EuropeNorwayOceaniaPakistanPanamaPeruPhilippinesPolandPortugalRomaniaRussiaSaudi ArabiaScotlandSenegalSerbiaSierra LeoneSingaporeSomaliaSouth AfricaSouth AmericaSouth Central AsiaSouth Eastern AsiaSouthern EuropeSpainSri LankaSt. Vincent and the GrenadinesSudanSwedenSwitzerlandSyriaTaiwanThailandTrinidad and TobagoTurkeyUgandaUkraineUruguayUzbekistanVenezuelaVietnamWest IndiesWestern AfricaWestern AsiaWestern EuropeYemenZaireZimbabweAzores
GED/Equivalency
Income
Poverty
Unemployment
Labor Participation
Family Structure
Vehicle Availability
Education Level
Disability

GED/Equivalency Comparison

Immigrants from Hungary

Filipinos

Exceptional
Exceptional
87.2%
GED/EQUIVALENCY
96.0/ 100
METRIC RATING
104th/ 347
METRIC RANK
89.5%
GED/EQUIVALENCY
100.0/ 100
METRIC RATING
2nd/ 347
METRIC RANK

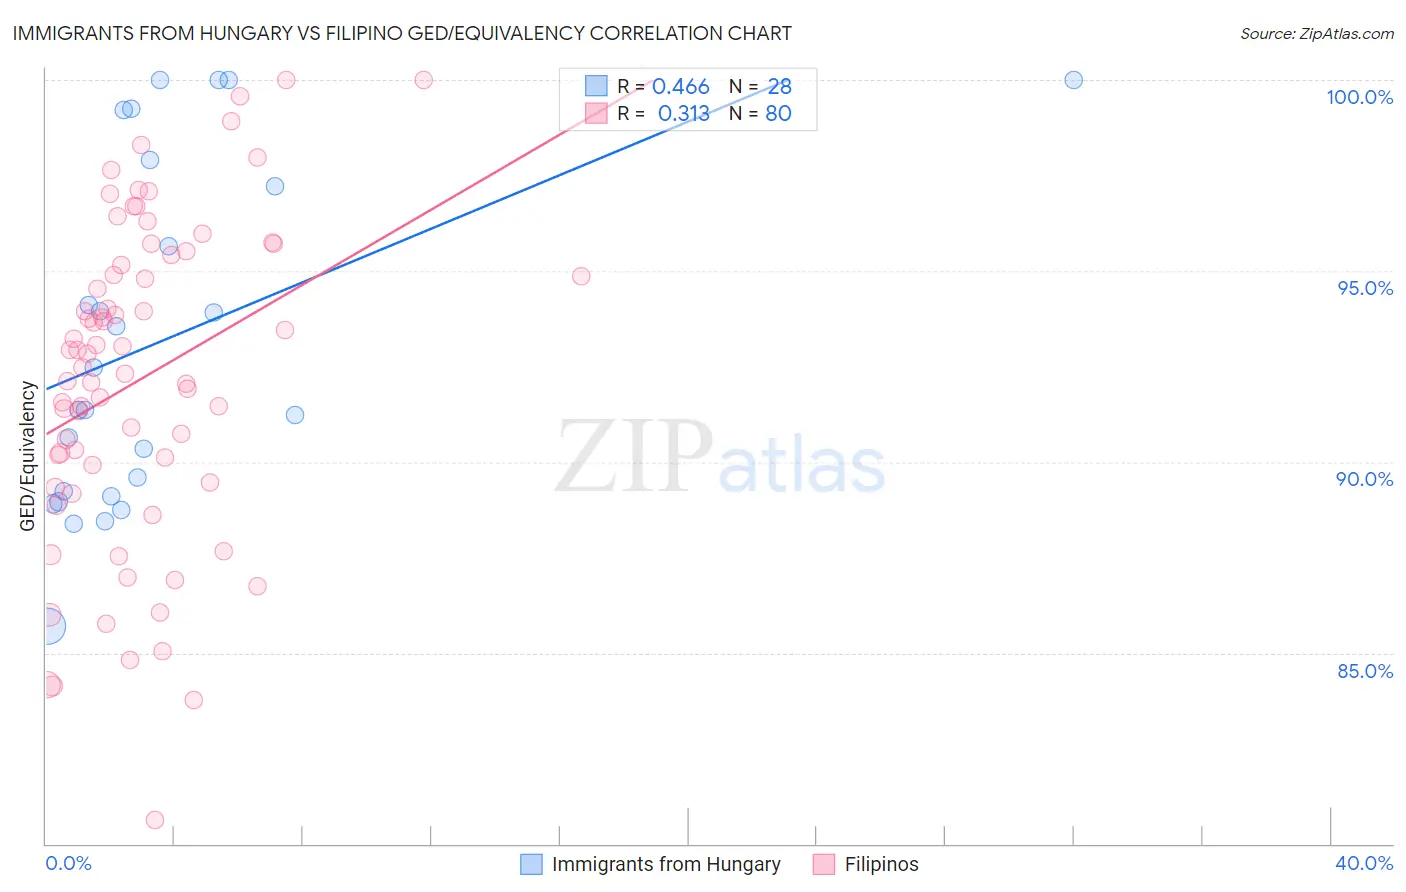
Immigrants from Hungary vs Filipino GED/Equivalency Correlation Chart

The statistical analysis conducted on geographies consisting of 195,707,305 people shows a moderate positive correlation between the proportion of Immigrants from Hungary and percentage of population with at least ged/equivalency education in the United States with a correlation coefficient (R) of 0.466 and weighted average of 87.2%. Similarly, the statistical analysis conducted on geographies consisting of 254,349,672 people shows a mild positive correlation between the proportion of Filipinos and percentage of population with at least ged/equivalency education in the United States with a correlation coefficient (R) of 0.313 and weighted average of 89.5%, a difference of 2.7%.
Immigrants from Hungary vs Filipino GED/Equivalency

GED/Equivalency Correlation Summary

MeasurementImmigrants from HungaryFilipino
Minimum85.7%80.6%
Maximum100.0%100.0%
Range14.3%19.4%
Mean93.2%92.2%
Median91.9%92.7%
Interquartile 25% (IQ1)89.2%89.7%
Interquartile 75% (IQ3)97.6%95.3%
Interquartile Range (IQR)8.4%5.6%
Standard Deviation (Sample)4.4%4.2%
Standard Deviation (Population)4.4%4.2%

Similar Demographics by GED/Equivalency

Demographics Similar to Immigrants from Hungary by GED/Equivalency

In terms of ged/equivalency, the demographic groups most similar to Immigrants from Hungary are Jordanian (87.2%, a difference of 0.010%), Indian (Asian) (87.1%, a difference of 0.010%), Lebanese (87.2%, a difference of 0.020%), Immigrants from Zimbabwe (87.1%, a difference of 0.030%), and Icelander (87.1%, a difference of 0.030%).
DemographicsRating | RankGED/Equivalency
Immigrants | Western Europe
97.3
/100
|
#97
Exceptional
87.3%
Immigrants | Croatia
96.9
/100
|
#98
Exceptional
87.3%
Immigrants | Belarus
96.9
/100
|
#99
Exceptional
87.3%
Palestinians
96.8
/100
|
#100
Exceptional
87.3%
Syrians
96.6
/100
|
#101
Exceptional
87.2%
Lebanese
96.2
/100
|
#102
Exceptional
87.2%
Jordanians
96.1
/100
|
#103
Exceptional
87.2%
Immigrants | Hungary
96.0
/100
|
#104
Exceptional
87.2%
Indians (Asian)
95.9
/100
|
#105
Exceptional
87.1%
Immigrants | Zimbabwe
95.8
/100
|
#106
Exceptional
87.1%
Icelanders
95.7
/100
|
#107
Exceptional
87.1%
Canadians
95.6
/100
|
#108
Exceptional
87.1%
Immigrants | Eastern Europe
95.5
/100
|
#109
Exceptional
87.1%
Egyptians
95.3
/100
|
#110
Exceptional
87.1%
French
95.2
/100
|
#111
Exceptional
87.1%

Demographics Similar to Filipinos by GED/Equivalency

In terms of ged/equivalency, the demographic groups most similar to Filipinos are Immigrants from Singapore (89.3%, a difference of 0.21%), Immigrants from India (89.7%, a difference of 0.26%), Iranian (89.2%, a difference of 0.30%), Latvian (89.2%, a difference of 0.40%), and Thai (89.1%, a difference of 0.42%).
DemographicsRating | RankGED/Equivalency
Immigrants | India
100.0
/100
|
#1
Exceptional
89.7%
Filipinos
100.0
/100
|
#2
Exceptional
89.5%
Immigrants | Singapore
100.0
/100
|
#3
Exceptional
89.3%
Iranians
100.0
/100
|
#4
Exceptional
89.2%
Latvians
100.0
/100
|
#5
Exceptional
89.2%
Thais
100.0
/100
|
#6
Exceptional
89.1%
Eastern Europeans
99.9
/100
|
#7
Exceptional
89.1%
Carpatho Rusyns
99.9
/100
|
#8
Exceptional
89.1%
Chinese
99.9
/100
|
#9
Exceptional
89.0%
Norwegians
99.9
/100
|
#10
Exceptional
89.0%
Bulgarians
99.9
/100
|
#11
Exceptional
89.0%
Lithuanians
99.9
/100
|
#12
Exceptional
88.9%
Immigrants | Iran
99.9
/100
|
#13
Exceptional
88.9%
Cypriots
99.9
/100
|
#14
Exceptional
88.9%
Okinawans
99.9
/100
|
#15
Exceptional
88.9%