Houma vs Immigrants from Africa GED/Equivalency
COMPARE
Houma
Immigrants from Africa
GED/Equivalency
GED/Equivalency Comparison
Houma
Immigrants from Africa
75.0%
GED/EQUIVALENCY
0.0/ 100
METRIC RATING
346th/ 347
METRIC RANK
85.1%
GED/EQUIVALENCY
17.5/ 100
METRIC RATING
198th/ 347
METRIC RANK
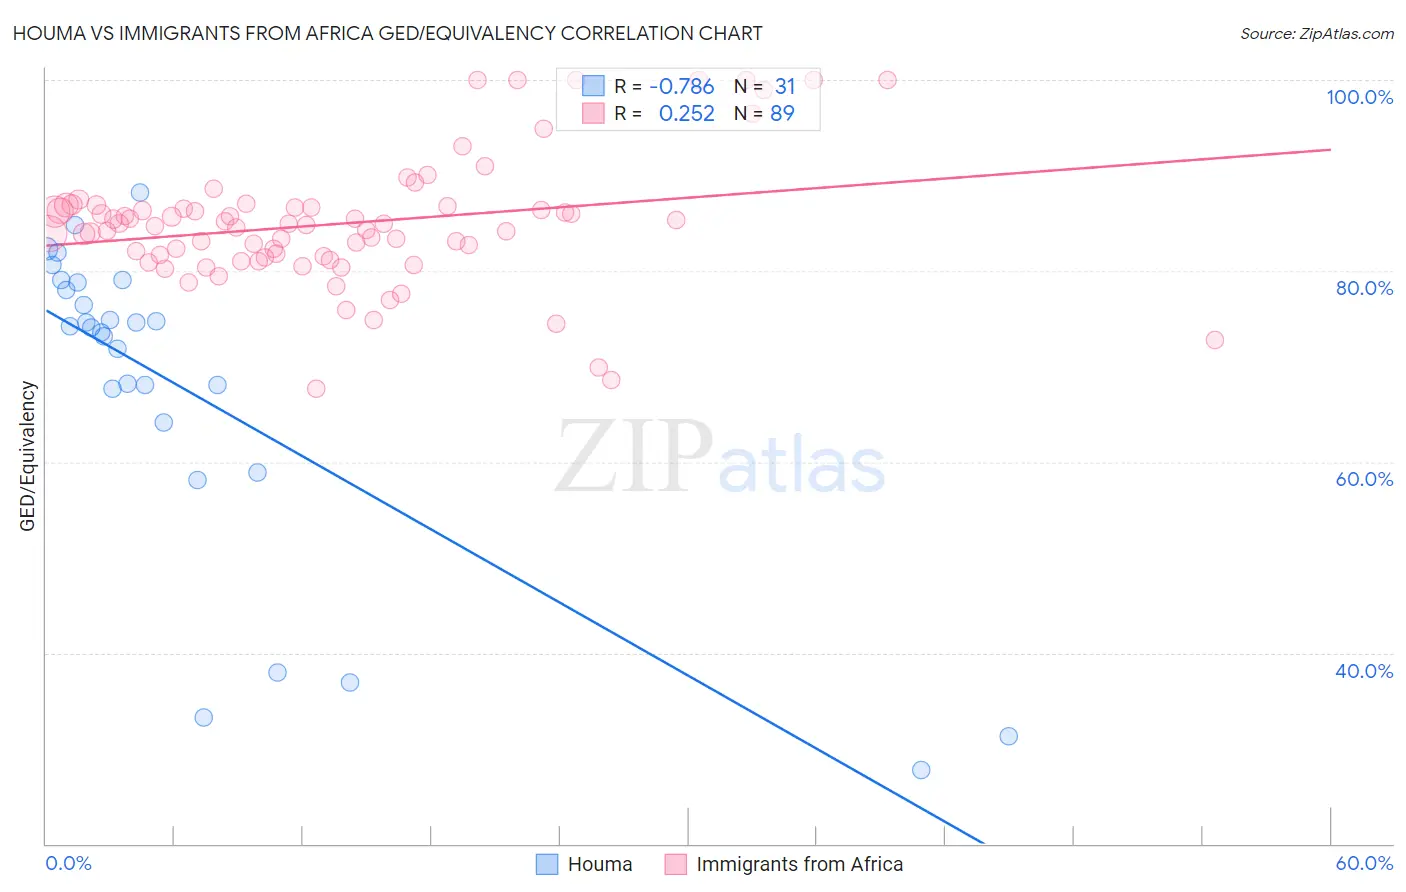
Houma vs Immigrants from Africa GED/Equivalency Correlation Chart
The statistical analysis conducted on geographies consisting of 36,795,916 people shows a strong negative correlation between the proportion of Houma and percentage of population with at least ged/equivalency education in the United States with a correlation coefficient (R) of -0.786 and weighted average of 75.0%. Similarly, the statistical analysis conducted on geographies consisting of 469,440,133 people shows a weak positive correlation between the proportion of Immigrants from Africa and percentage of population with at least ged/equivalency education in the United States with a correlation coefficient (R) of 0.252 and weighted average of 85.1%, a difference of 13.5%.
GED/Equivalency Correlation Summary
| Measurement | Houma | Immigrants from Africa |
| Minimum | 27.8% | 67.7% |
| Maximum | 88.2% | 100.0% |
| Range | 60.4% | 32.3% |
| Mean | 67.6% | 85.0% |
| Median | 74.1% | 84.8% |
| Interquartile 25% (IQ1) | 64.2% | 81.4% |
| Interquartile 75% (IQ3) | 78.8% | 86.7% |
| Interquartile Range (IQR) | 14.6% | 5.3% |
| Standard Deviation (Sample) | 16.7% | 6.7% |
| Standard Deviation (Population) | 16.4% | 6.7% |
Similar Demographics by GED/Equivalency
Demographics Similar to Houma by GED/Equivalency
In terms of ged/equivalency, the demographic groups most similar to Houma are Yakama (74.5%, a difference of 0.61%), Immigrants from Mexico (75.7%, a difference of 0.94%), Spanish American Indian (76.3%, a difference of 1.8%), Immigrants from Central America (76.4%, a difference of 1.9%), and Pima (76.4%, a difference of 2.0%).
| Demographics | Rating | Rank | GED/Equivalency |
| Salvadorans | 0.0 /100 | #333 | Tragic 78.6% |
| Guatemalans | 0.0 /100 | #334 | Tragic 78.5% |
| Immigrants | Latin America | 0.0 /100 | #335 | Tragic 78.5% |
| Immigrants | Dominican Republic | 0.0 /100 | #336 | Tragic 78.0% |
| Immigrants | Yemen | 0.0 /100 | #337 | Tragic 77.9% |
| Immigrants | Guatemala | 0.0 /100 | #338 | Tragic 77.9% |
| Immigrants | El Salvador | 0.0 /100 | #339 | Tragic 77.6% |
| Tohono O'odham | 0.0 /100 | #340 | Tragic 77.5% |
| Mexicans | 0.0 /100 | #341 | Tragic 77.4% |
| Pima | 0.0 /100 | #342 | Tragic 76.4% |
| Immigrants | Central America | 0.0 /100 | #343 | Tragic 76.4% |
| Spanish American Indians | 0.0 /100 | #344 | Tragic 76.3% |
| Immigrants | Mexico | 0.0 /100 | #345 | Tragic 75.7% |
| Houma | 0.0 /100 | #346 | Tragic 75.0% |
| Yakama | 0.0 /100 | #347 | Tragic 74.5% |
Demographics Similar to Immigrants from Africa by GED/Equivalency
In terms of ged/equivalency, the demographic groups most similar to Immigrants from Africa are Somali (85.0%, a difference of 0.040%), Uruguayan (85.0%, a difference of 0.060%), Portuguese (85.0%, a difference of 0.060%), Cree (85.0%, a difference of 0.060%), and Panamanian (85.0%, a difference of 0.080%).
| Demographics | Rating | Rank | GED/Equivalency |
| South American Indians | 22.8 /100 | #191 | Fair 85.2% |
| Immigrants | Nonimmigrants | 22.7 /100 | #192 | Fair 85.2% |
| Delaware | 22.2 /100 | #193 | Fair 85.2% |
| Puget Sound Salish | 20.8 /100 | #194 | Fair 85.2% |
| Chippewa | 20.8 /100 | #195 | Fair 85.2% |
| Tongans | 20.7 /100 | #196 | Fair 85.2% |
| Costa Ricans | 20.4 /100 | #197 | Fair 85.2% |
| Immigrants | Africa | 17.5 /100 | #198 | Poor 85.1% |
| Somalis | 16.4 /100 | #199 | Poor 85.0% |
| Uruguayans | 16.0 /100 | #200 | Poor 85.0% |
| Portuguese | 15.9 /100 | #201 | Poor 85.0% |
| Cree | 15.9 /100 | #202 | Poor 85.0% |
| Panamanians | 15.3 /100 | #203 | Poor 85.0% |
| Hawaiians | 15.2 /100 | #204 | Poor 85.0% |
| Liberians | 14.6 /100 | #205 | Poor 85.0% |