Jamaican vs Immigrants from Africa GED/Equivalency
COMPARE
Jamaican
Immigrants from Africa
GED/Equivalency
GED/Equivalency Comparison
Jamaicans
Immigrants from Africa
83.3%
GED/EQUIVALENCY
0.4/ 100
METRIC RATING
257th/ 347
METRIC RANK
85.1%
GED/EQUIVALENCY
17.5/ 100
METRIC RATING
198th/ 347
METRIC RANK
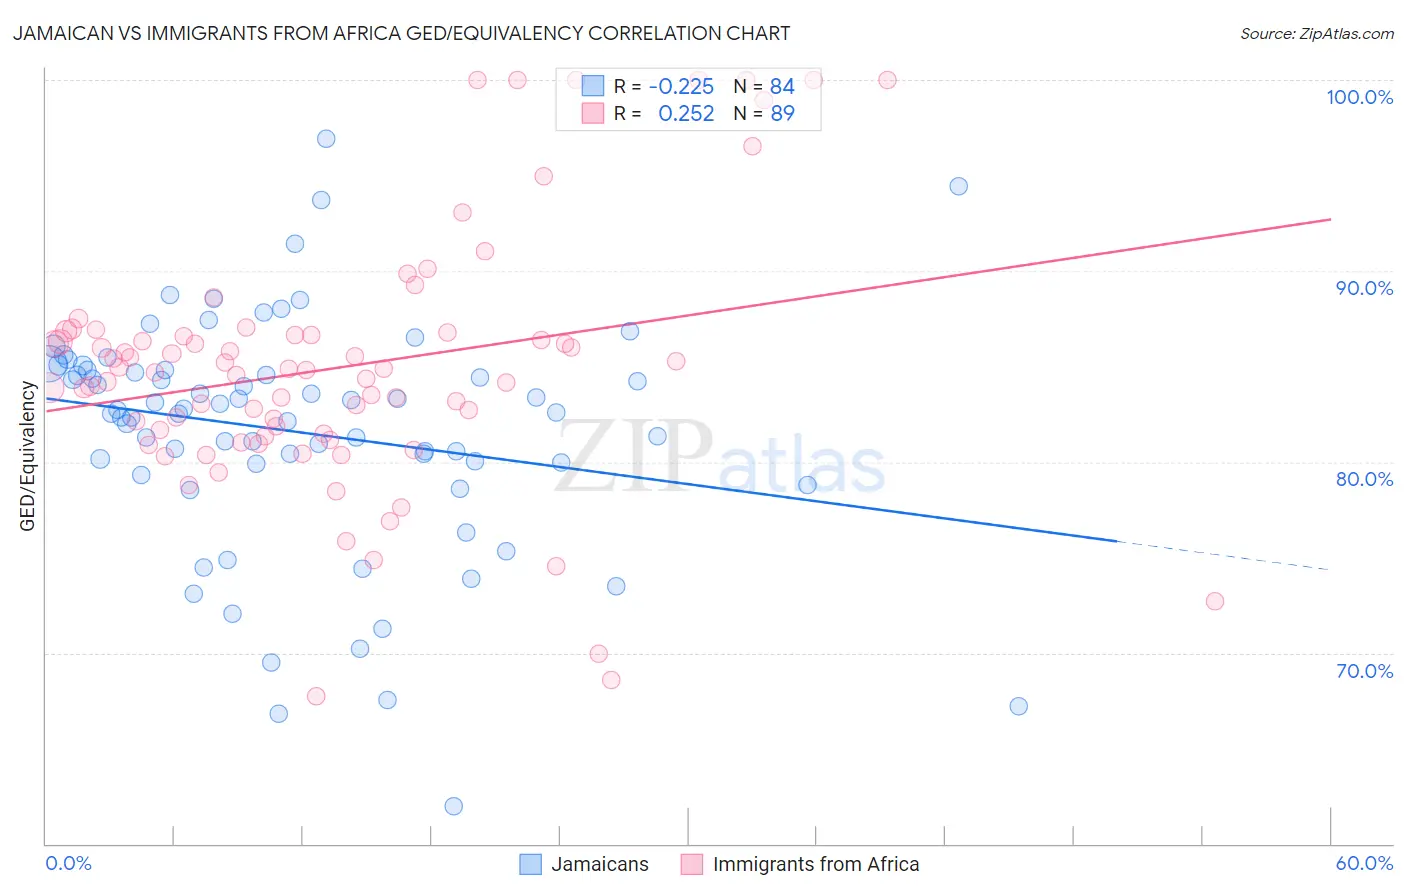
Jamaican vs Immigrants from Africa GED/Equivalency Correlation Chart
The statistical analysis conducted on geographies consisting of 368,084,562 people shows a weak negative correlation between the proportion of Jamaicans and percentage of population with at least ged/equivalency education in the United States with a correlation coefficient (R) of -0.225 and weighted average of 83.3%. Similarly, the statistical analysis conducted on geographies consisting of 469,440,133 people shows a weak positive correlation between the proportion of Immigrants from Africa and percentage of population with at least ged/equivalency education in the United States with a correlation coefficient (R) of 0.252 and weighted average of 85.1%, a difference of 2.1%.
GED/Equivalency Correlation Summary
| Measurement | Jamaican | Immigrants from Africa |
| Minimum | 61.9% | 67.7% |
| Maximum | 96.9% | 100.0% |
| Range | 35.0% | 32.3% |
| Mean | 81.6% | 85.0% |
| Median | 82.7% | 84.8% |
| Interquartile 25% (IQ1) | 80.0% | 81.4% |
| Interquartile 75% (IQ3) | 84.8% | 86.7% |
| Interquartile Range (IQR) | 4.8% | 5.3% |
| Standard Deviation (Sample) | 6.2% | 6.7% |
| Standard Deviation (Population) | 6.1% | 6.7% |
Similar Demographics by GED/Equivalency
Demographics Similar to Jamaicans by GED/Equivalency
In terms of ged/equivalency, the demographic groups most similar to Jamaicans are Malaysian (83.3%, a difference of 0.030%), African (83.4%, a difference of 0.13%), Colville (83.4%, a difference of 0.14%), Immigrants from Vietnam (83.2%, a difference of 0.17%), and Choctaw (83.1%, a difference of 0.20%).
| Demographics | Rating | Rank | GED/Equivalency |
| Shoshone | 1.0 /100 | #250 | Tragic 83.7% |
| Spanish Americans | 0.8 /100 | #251 | Tragic 83.6% |
| Bahamians | 0.8 /100 | #252 | Tragic 83.6% |
| Comanche | 0.7 /100 | #253 | Tragic 83.6% |
| Creek | 0.7 /100 | #254 | Tragic 83.6% |
| Colville | 0.5 /100 | #255 | Tragic 83.4% |
| Africans | 0.5 /100 | #256 | Tragic 83.4% |
| Jamaicans | 0.4 /100 | #257 | Tragic 83.3% |
| Malaysians | 0.4 /100 | #258 | Tragic 83.3% |
| Immigrants | Vietnam | 0.3 /100 | #259 | Tragic 83.2% |
| Choctaw | 0.3 /100 | #260 | Tragic 83.1% |
| Inupiat | 0.2 /100 | #261 | Tragic 83.1% |
| Immigrants | Armenia | 0.2 /100 | #262 | Tragic 83.1% |
| Immigrants | Congo | 0.2 /100 | #263 | Tragic 83.1% |
| Bangladeshis | 0.2 /100 | #264 | Tragic 83.1% |
Demographics Similar to Immigrants from Africa by GED/Equivalency
In terms of ged/equivalency, the demographic groups most similar to Immigrants from Africa are Somali (85.0%, a difference of 0.040%), Uruguayan (85.0%, a difference of 0.060%), Portuguese (85.0%, a difference of 0.060%), Cree (85.0%, a difference of 0.060%), and Panamanian (85.0%, a difference of 0.080%).
| Demographics | Rating | Rank | GED/Equivalency |
| South American Indians | 22.8 /100 | #191 | Fair 85.2% |
| Immigrants | Nonimmigrants | 22.7 /100 | #192 | Fair 85.2% |
| Delaware | 22.2 /100 | #193 | Fair 85.2% |
| Puget Sound Salish | 20.8 /100 | #194 | Fair 85.2% |
| Chippewa | 20.8 /100 | #195 | Fair 85.2% |
| Tongans | 20.7 /100 | #196 | Fair 85.2% |
| Costa Ricans | 20.4 /100 | #197 | Fair 85.2% |
| Immigrants | Africa | 17.5 /100 | #198 | Poor 85.1% |
| Somalis | 16.4 /100 | #199 | Poor 85.0% |
| Uruguayans | 16.0 /100 | #200 | Poor 85.0% |
| Portuguese | 15.9 /100 | #201 | Poor 85.0% |
| Cree | 15.9 /100 | #202 | Poor 85.0% |
| Panamanians | 15.3 /100 | #203 | Poor 85.0% |
| Hawaiians | 15.2 /100 | #204 | Poor 85.0% |
| Liberians | 14.6 /100 | #205 | Poor 85.0% |