Immigrants from South Eastern Asia vs Immigrants from Africa GED/Equivalency
COMPARE
Immigrants from South Eastern Asia
Immigrants from Africa
GED/Equivalency
GED/Equivalency Comparison
Immigrants from South Eastern Asia
Immigrants from Africa
84.1%
GED/EQUIVALENCY
2.5/ 100
METRIC RATING
240th/ 347
METRIC RANK
85.1%
GED/EQUIVALENCY
17.5/ 100
METRIC RATING
198th/ 347
METRIC RANK
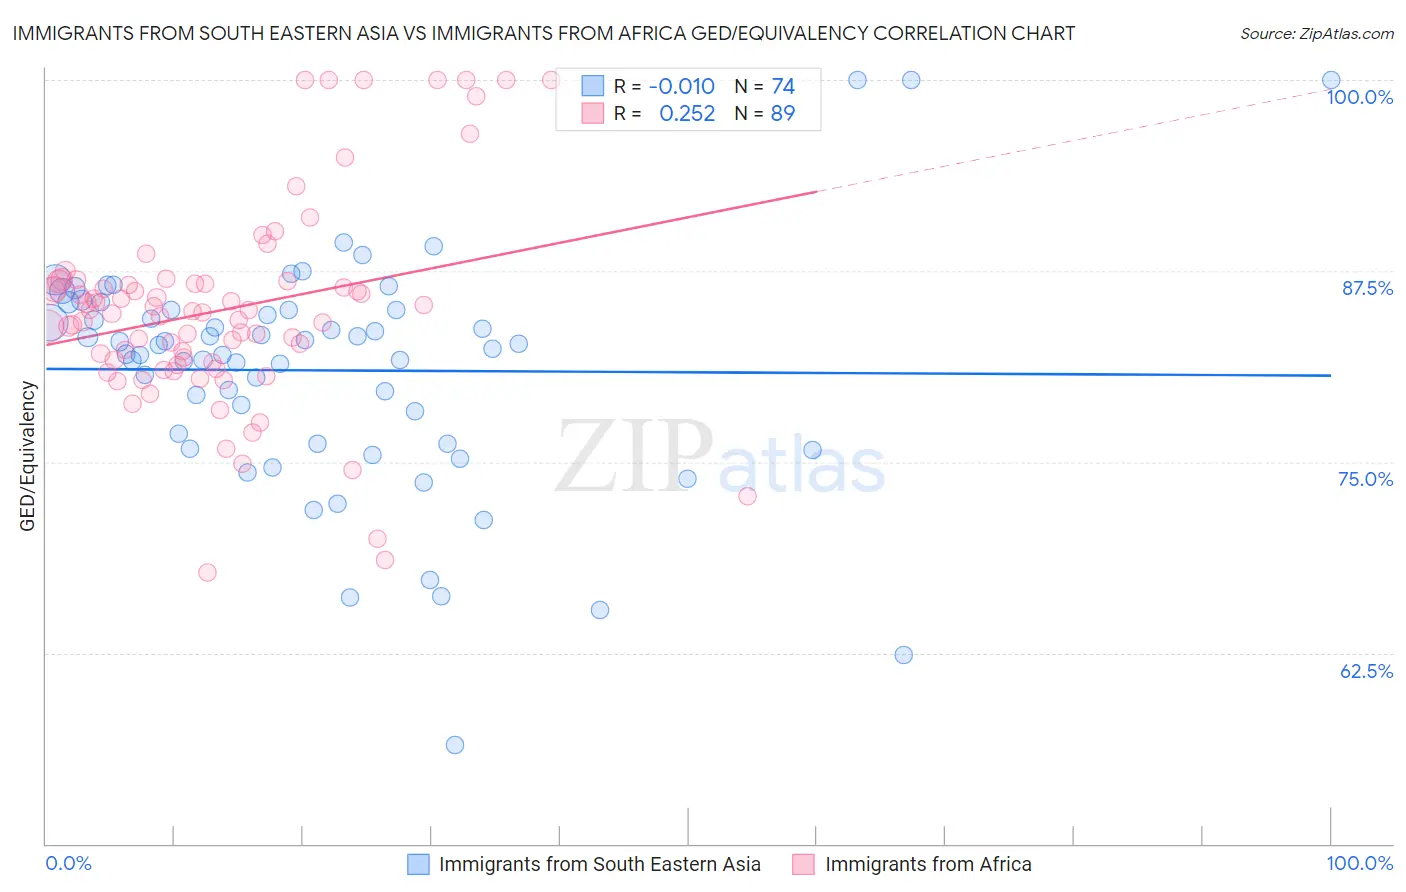
Immigrants from South Eastern Asia vs Immigrants from Africa GED/Equivalency Correlation Chart
The statistical analysis conducted on geographies consisting of 512,708,901 people shows no correlation between the proportion of Immigrants from South Eastern Asia and percentage of population with at least ged/equivalency education in the United States with a correlation coefficient (R) of -0.010 and weighted average of 84.1%. Similarly, the statistical analysis conducted on geographies consisting of 469,440,133 people shows a weak positive correlation between the proportion of Immigrants from Africa and percentage of population with at least ged/equivalency education in the United States with a correlation coefficient (R) of 0.252 and weighted average of 85.1%, a difference of 1.1%.
GED/Equivalency Correlation Summary
| Measurement | Immigrants from South Eastern Asia | Immigrants from Africa |
| Minimum | 56.5% | 67.7% |
| Maximum | 100.0% | 100.0% |
| Range | 43.5% | 32.3% |
| Mean | 81.0% | 85.0% |
| Median | 82.5% | 84.8% |
| Interquartile 25% (IQ1) | 76.2% | 81.4% |
| Interquartile 75% (IQ3) | 84.9% | 86.7% |
| Interquartile Range (IQR) | 8.8% | 5.3% |
| Standard Deviation (Sample) | 7.6% | 6.7% |
| Standard Deviation (Population) | 7.6% | 6.7% |
Similar Demographics by GED/Equivalency
Demographics Similar to Immigrants from South Eastern Asia by GED/Equivalency
In terms of ged/equivalency, the demographic groups most similar to Immigrants from South Eastern Asia are Immigrants from Bahamas (84.2%, a difference of 0.020%), Immigrants from Peru (84.2%, a difference of 0.040%), Subsaharan African (84.2%, a difference of 0.10%), Senegalese (84.0%, a difference of 0.14%), and Sri Lankan (84.0%, a difference of 0.16%).
| Demographics | Rating | Rank | GED/Equivalency |
| Immigrants | Panama | 4.1 /100 | #233 | Tragic 84.4% |
| Immigrants | Nigeria | 3.6 /100 | #234 | Tragic 84.3% |
| Ghanaians | 3.5 /100 | #235 | Tragic 84.3% |
| Immigrants | Eritrea | 3.5 /100 | #236 | Tragic 84.3% |
| Sub-Saharan Africans | 3.0 /100 | #237 | Tragic 84.2% |
| Immigrants | Peru | 2.7 /100 | #238 | Tragic 84.2% |
| Immigrants | Bahamas | 2.6 /100 | #239 | Tragic 84.2% |
| Immigrants | South Eastern Asia | 2.5 /100 | #240 | Tragic 84.1% |
| Senegalese | 1.9 /100 | #241 | Tragic 84.0% |
| Sri Lankans | 1.9 /100 | #242 | Tragic 84.0% |
| Cherokee | 1.3 /100 | #243 | Tragic 83.9% |
| Immigrants | Ghana | 1.3 /100 | #244 | Tragic 83.9% |
| Immigrants | Senegal | 1.2 /100 | #245 | Tragic 83.8% |
| Chickasaw | 1.2 /100 | #246 | Tragic 83.8% |
| Immigrants | Western Africa | 1.1 /100 | #247 | Tragic 83.8% |
Demographics Similar to Immigrants from Africa by GED/Equivalency
In terms of ged/equivalency, the demographic groups most similar to Immigrants from Africa are Somali (85.0%, a difference of 0.040%), Uruguayan (85.0%, a difference of 0.060%), Portuguese (85.0%, a difference of 0.060%), Cree (85.0%, a difference of 0.060%), and Panamanian (85.0%, a difference of 0.080%).
| Demographics | Rating | Rank | GED/Equivalency |
| South American Indians | 22.8 /100 | #191 | Fair 85.2% |
| Immigrants | Nonimmigrants | 22.7 /100 | #192 | Fair 85.2% |
| Delaware | 22.2 /100 | #193 | Fair 85.2% |
| Puget Sound Salish | 20.8 /100 | #194 | Fair 85.2% |
| Chippewa | 20.8 /100 | #195 | Fair 85.2% |
| Tongans | 20.7 /100 | #196 | Fair 85.2% |
| Costa Ricans | 20.4 /100 | #197 | Fair 85.2% |
| Immigrants | Africa | 17.5 /100 | #198 | Poor 85.1% |
| Somalis | 16.4 /100 | #199 | Poor 85.0% |
| Uruguayans | 16.0 /100 | #200 | Poor 85.0% |
| Portuguese | 15.9 /100 | #201 | Poor 85.0% |
| Cree | 15.9 /100 | #202 | Poor 85.0% |
| Panamanians | 15.3 /100 | #203 | Poor 85.0% |
| Hawaiians | 15.2 /100 | #204 | Poor 85.0% |
| Liberians | 14.6 /100 | #205 | Poor 85.0% |