Immigrants from Spain vs Ghanaian GED/Equivalency
COMPARE
Immigrants from Spain
Ghanaian
GED/Equivalency
GED/Equivalency Comparison
Immigrants from Spain
Ghanaians
86.7%
GED/EQUIVALENCY
88.5/ 100
METRIC RATING
131st/ 347
METRIC RANK
84.3%
GED/EQUIVALENCY
3.5/ 100
METRIC RATING
235th/ 347
METRIC RANK
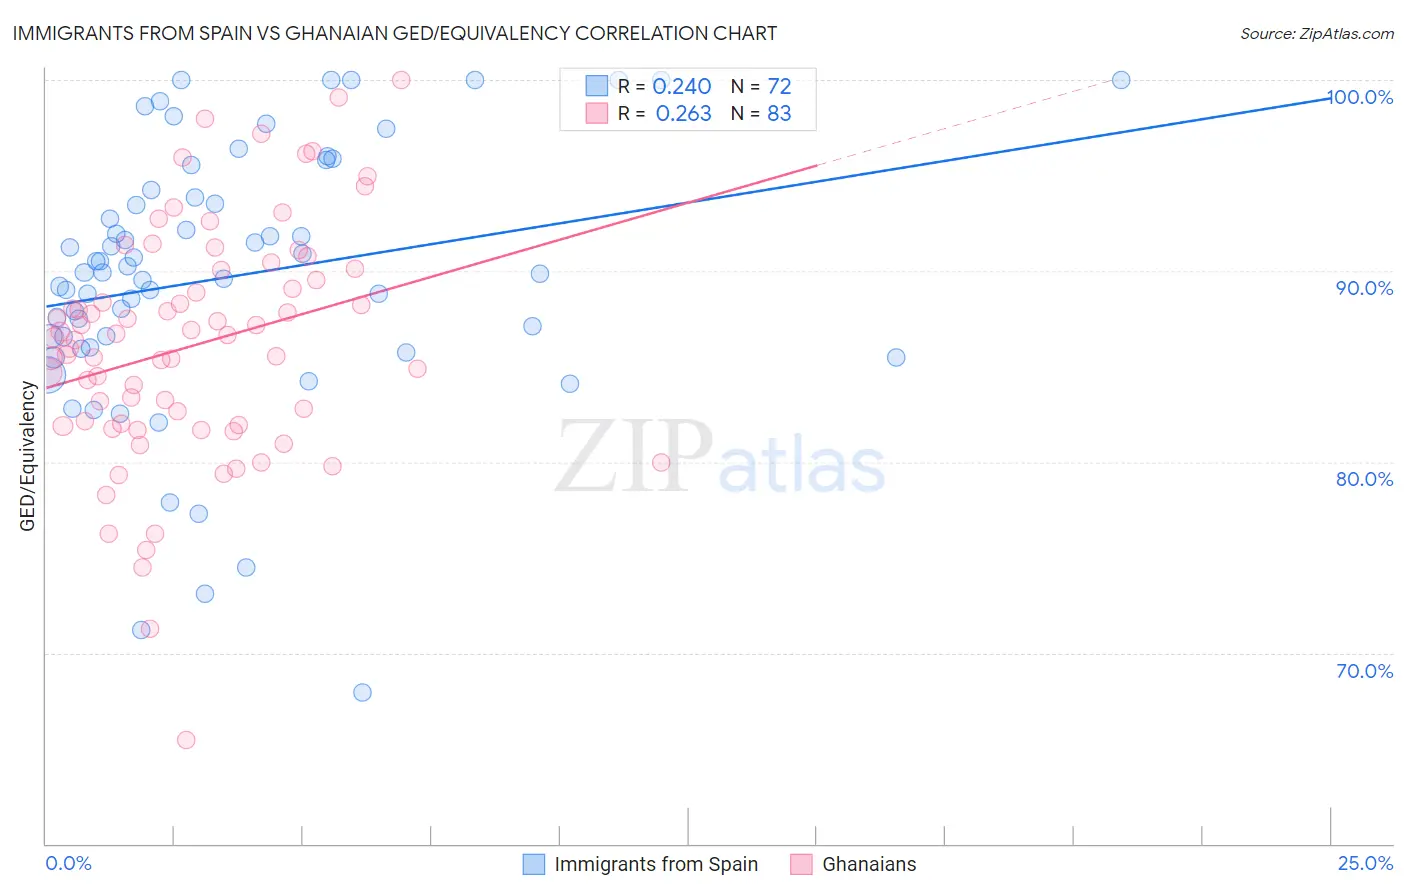
Immigrants from Spain vs Ghanaian GED/Equivalency Correlation Chart
The statistical analysis conducted on geographies consisting of 239,682,725 people shows a weak positive correlation between the proportion of Immigrants from Spain and percentage of population with at least ged/equivalency education in the United States with a correlation coefficient (R) of 0.240 and weighted average of 86.7%. Similarly, the statistical analysis conducted on geographies consisting of 190,714,079 people shows a weak positive correlation between the proportion of Ghanaians and percentage of population with at least ged/equivalency education in the United States with a correlation coefficient (R) of 0.263 and weighted average of 84.3%, a difference of 2.8%.
GED/Equivalency Correlation Summary
| Measurement | Immigrants from Spain | Ghanaian |
| Minimum | 67.9% | 65.4% |
| Maximum | 100.0% | 100.0% |
| Range | 32.1% | 34.6% |
| Mean | 89.7% | 86.1% |
| Median | 89.9% | 86.5% |
| Interquartile 25% (IQ1) | 86.3% | 81.9% |
| Interquartile 75% (IQ3) | 94.1% | 90.1% |
| Interquartile Range (IQR) | 7.8% | 8.1% |
| Standard Deviation (Sample) | 7.0% | 6.2% |
| Standard Deviation (Population) | 6.9% | 6.2% |
Similar Demographics by GED/Equivalency
Demographics Similar to Immigrants from Spain by GED/Equivalency
In terms of ged/equivalency, the demographic groups most similar to Immigrants from Spain are Immigrants from Brazil (86.6%, a difference of 0.0%), Tsimshian (86.6%, a difference of 0.010%), Immigrants from Ukraine (86.7%, a difference of 0.020%), Immigrants from Germany (86.7%, a difference of 0.020%), and Albanian (86.6%, a difference of 0.040%).
| Demographics | Rating | Rank | GED/Equivalency |
| Immigrants | Egypt | 90.4 /100 | #124 | Exceptional 86.7% |
| Celtics | 90.4 /100 | #125 | Exceptional 86.7% |
| Asians | 90.3 /100 | #126 | Exceptional 86.7% |
| Argentineans | 89.7 /100 | #127 | Excellent 86.7% |
| Yugoslavians | 89.5 /100 | #128 | Excellent 86.7% |
| Immigrants | Ukraine | 88.9 /100 | #129 | Excellent 86.7% |
| Immigrants | Germany | 88.8 /100 | #130 | Excellent 86.7% |
| Immigrants | Spain | 88.5 /100 | #131 | Excellent 86.7% |
| Immigrants | Brazil | 88.4 /100 | #132 | Excellent 86.6% |
| Tsimshian | 88.3 /100 | #133 | Excellent 86.6% |
| Albanians | 87.7 /100 | #134 | Excellent 86.6% |
| Immigrants | Asia | 87.4 /100 | #135 | Excellent 86.6% |
| Chileans | 86.9 /100 | #136 | Excellent 86.6% |
| Arabs | 86.7 /100 | #137 | Excellent 86.6% |
| Immigrants | Argentina | 86.5 /100 | #138 | Excellent 86.6% |
Demographics Similar to Ghanaians by GED/Equivalency
In terms of ged/equivalency, the demographic groups most similar to Ghanaians are Immigrants from Eritrea (84.3%, a difference of 0.0%), Immigrants from Nigeria (84.3%, a difference of 0.020%), Subsaharan African (84.2%, a difference of 0.070%), Immigrants from South America (84.4%, a difference of 0.10%), and Immigrants from Panama (84.4%, a difference of 0.10%).
| Demographics | Rating | Rank | GED/Equivalency |
| Immigrants | Liberia | 4.9 /100 | #228 | Tragic 84.4% |
| Immigrants | Uruguay | 4.6 /100 | #229 | Tragic 84.4% |
| Immigrants | Colombia | 4.5 /100 | #230 | Tragic 84.4% |
| Immigrants | Middle Africa | 4.3 /100 | #231 | Tragic 84.4% |
| Immigrants | South America | 4.2 /100 | #232 | Tragic 84.4% |
| Immigrants | Panama | 4.1 /100 | #233 | Tragic 84.4% |
| Immigrants | Nigeria | 3.6 /100 | #234 | Tragic 84.3% |
| Ghanaians | 3.5 /100 | #235 | Tragic 84.3% |
| Immigrants | Eritrea | 3.5 /100 | #236 | Tragic 84.3% |
| Sub-Saharan Africans | 3.0 /100 | #237 | Tragic 84.2% |
| Immigrants | Peru | 2.7 /100 | #238 | Tragic 84.2% |
| Immigrants | Bahamas | 2.6 /100 | #239 | Tragic 84.2% |
| Immigrants | South Eastern Asia | 2.5 /100 | #240 | Tragic 84.1% |
| Senegalese | 1.9 /100 | #241 | Tragic 84.0% |
| Sri Lankans | 1.9 /100 | #242 | Tragic 84.0% |