Immigrants from Spain vs Immigrants GED/Equivalency
COMPARE
Immigrants from Spain
Immigrants
GED/Equivalency
GED/Equivalency Comparison
Immigrants from Spain
Immigrants
86.7%
GED/EQUIVALENCY
88.5/ 100
METRIC RATING
131st/ 347
METRIC RANK
82.6%
GED/EQUIVALENCY
0.1/ 100
METRIC RATING
282nd/ 347
METRIC RANK
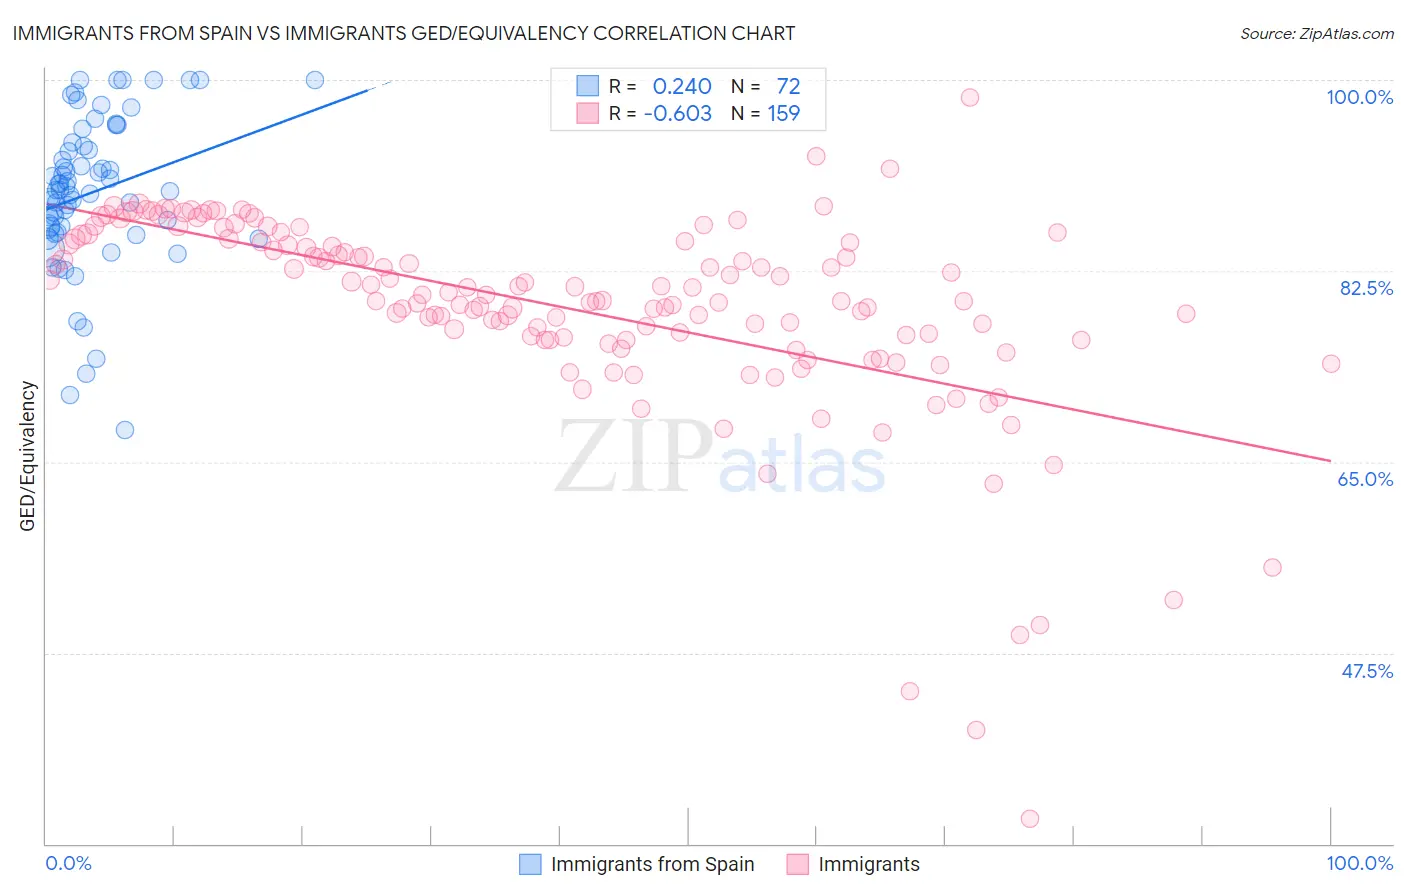
Immigrants from Spain vs Immigrants GED/Equivalency Correlation Chart
The statistical analysis conducted on geographies consisting of 239,682,725 people shows a weak positive correlation between the proportion of Immigrants from Spain and percentage of population with at least ged/equivalency education in the United States with a correlation coefficient (R) of 0.240 and weighted average of 86.7%. Similarly, the statistical analysis conducted on geographies consisting of 577,784,417 people shows a significant negative correlation between the proportion of Immigrants and percentage of population with at least ged/equivalency education in the United States with a correlation coefficient (R) of -0.603 and weighted average of 82.6%, a difference of 5.0%.
GED/Equivalency Correlation Summary
| Measurement | Immigrants from Spain | Immigrants |
| Minimum | 67.9% | 32.3% |
| Maximum | 100.0% | 98.4% |
| Range | 32.1% | 66.2% |
| Mean | 89.7% | 79.2% |
| Median | 89.9% | 80.3% |
| Interquartile 25% (IQ1) | 86.3% | 76.2% |
| Interquartile 75% (IQ3) | 94.1% | 85.2% |
| Interquartile Range (IQR) | 7.8% | 9.1% |
| Standard Deviation (Sample) | 7.0% | 9.4% |
| Standard Deviation (Population) | 6.9% | 9.4% |
Similar Demographics by GED/Equivalency
Demographics Similar to Immigrants from Spain by GED/Equivalency
In terms of ged/equivalency, the demographic groups most similar to Immigrants from Spain are Immigrants from Brazil (86.6%, a difference of 0.0%), Tsimshian (86.6%, a difference of 0.010%), Immigrants from Ukraine (86.7%, a difference of 0.020%), Immigrants from Germany (86.7%, a difference of 0.020%), and Albanian (86.6%, a difference of 0.040%).
| Demographics | Rating | Rank | GED/Equivalency |
| Immigrants | Egypt | 90.4 /100 | #124 | Exceptional 86.7% |
| Celtics | 90.4 /100 | #125 | Exceptional 86.7% |
| Asians | 90.3 /100 | #126 | Exceptional 86.7% |
| Argentineans | 89.7 /100 | #127 | Excellent 86.7% |
| Yugoslavians | 89.5 /100 | #128 | Excellent 86.7% |
| Immigrants | Ukraine | 88.9 /100 | #129 | Excellent 86.7% |
| Immigrants | Germany | 88.8 /100 | #130 | Excellent 86.7% |
| Immigrants | Spain | 88.5 /100 | #131 | Excellent 86.7% |
| Immigrants | Brazil | 88.4 /100 | #132 | Excellent 86.6% |
| Tsimshian | 88.3 /100 | #133 | Excellent 86.6% |
| Albanians | 87.7 /100 | #134 | Excellent 86.6% |
| Immigrants | Asia | 87.4 /100 | #135 | Excellent 86.6% |
| Chileans | 86.9 /100 | #136 | Excellent 86.6% |
| Arabs | 86.7 /100 | #137 | Excellent 86.6% |
| Immigrants | Argentina | 86.5 /100 | #138 | Excellent 86.6% |
Demographics Similar to Immigrants by GED/Equivalency
In terms of ged/equivalency, the demographic groups most similar to Immigrants are Indonesian (82.5%, a difference of 0.050%), Sioux (82.6%, a difference of 0.090%), Immigrants from Barbados (82.4%, a difference of 0.16%), Cheyenne (82.7%, a difference of 0.18%), and Immigrants from Fiji (82.7%, a difference of 0.19%).
| Demographics | Rating | Rank | GED/Equivalency |
| Seminole | 0.1 /100 | #275 | Tragic 82.8% |
| Blacks/African Americans | 0.1 /100 | #276 | Tragic 82.8% |
| Arapaho | 0.1 /100 | #277 | Tragic 82.8% |
| Immigrants | Laos | 0.1 /100 | #278 | Tragic 82.7% |
| Immigrants | Fiji | 0.1 /100 | #279 | Tragic 82.7% |
| Cheyenne | 0.1 /100 | #280 | Tragic 82.7% |
| Sioux | 0.1 /100 | #281 | Tragic 82.6% |
| Immigrants | Immigrants | 0.1 /100 | #282 | Tragic 82.6% |
| Indonesians | 0.1 /100 | #283 | Tragic 82.5% |
| Immigrants | Barbados | 0.1 /100 | #284 | Tragic 82.4% |
| Cajuns | 0.0 /100 | #285 | Tragic 82.4% |
| Immigrants | West Indies | 0.0 /100 | #286 | Tragic 82.4% |
| Japanese | 0.0 /100 | #287 | Tragic 82.4% |
| Pueblo | 0.0 /100 | #288 | Tragic 82.3% |
| Immigrants | Cambodia | 0.0 /100 | #289 | Tragic 82.2% |