Sioux vs Ghanaian GED/Equivalency
COMPARE
Sioux
Ghanaian
GED/Equivalency
GED/Equivalency Comparison
Sioux
Ghanaians
82.6%
GED/EQUIVALENCY
0.1/ 100
METRIC RATING
281st/ 347
METRIC RANK
84.3%
GED/EQUIVALENCY
3.5/ 100
METRIC RATING
235th/ 347
METRIC RANK
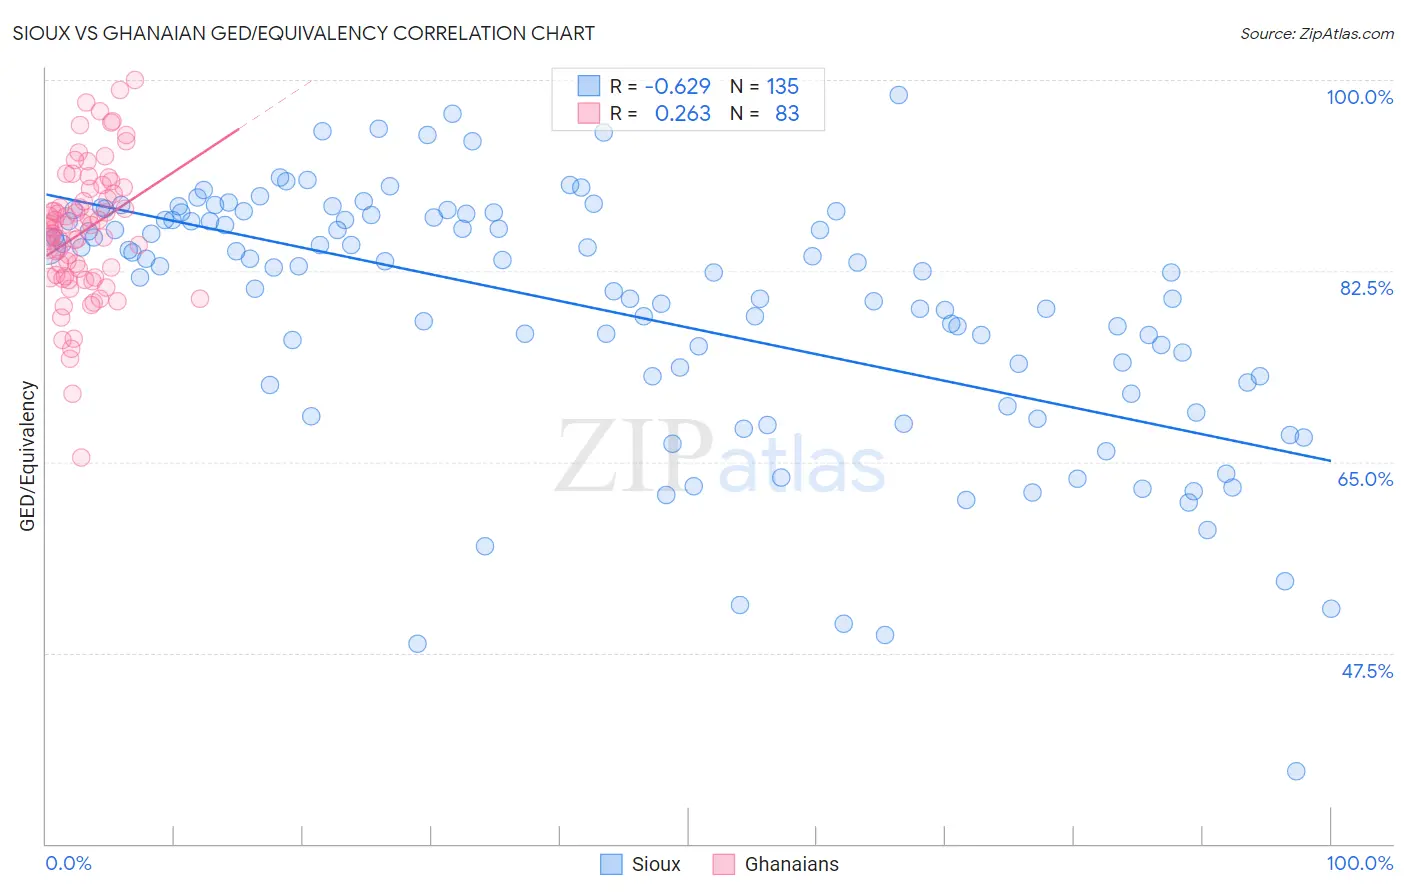
Sioux vs Ghanaian GED/Equivalency Correlation Chart
The statistical analysis conducted on geographies consisting of 234,200,345 people shows a significant negative correlation between the proportion of Sioux and percentage of population with at least ged/equivalency education in the United States with a correlation coefficient (R) of -0.629 and weighted average of 82.6%. Similarly, the statistical analysis conducted on geographies consisting of 190,714,079 people shows a weak positive correlation between the proportion of Ghanaians and percentage of population with at least ged/equivalency education in the United States with a correlation coefficient (R) of 0.263 and weighted average of 84.3%, a difference of 2.0%.
GED/Equivalency Correlation Summary
| Measurement | Sioux | Ghanaian |
| Minimum | 36.6% | 65.4% |
| Maximum | 98.6% | 100.0% |
| Range | 62.0% | 34.6% |
| Mean | 78.9% | 86.1% |
| Median | 82.8% | 86.5% |
| Interquartile 25% (IQ1) | 72.3% | 81.9% |
| Interquartile 75% (IQ3) | 87.4% | 90.1% |
| Interquartile Range (IQR) | 15.2% | 8.1% |
| Standard Deviation (Sample) | 11.7% | 6.2% |
| Standard Deviation (Population) | 11.6% | 6.2% |
Similar Demographics by GED/Equivalency
Demographics Similar to Sioux by GED/Equivalency
In terms of ged/equivalency, the demographic groups most similar to Sioux are Immigrants from Fiji (82.7%, a difference of 0.090%), Cheyenne (82.7%, a difference of 0.090%), Immigrants (82.6%, a difference of 0.090%), Immigrants from Laos (82.7%, a difference of 0.10%), and Arapaho (82.8%, a difference of 0.14%).
| Demographics | Rating | Rank | GED/Equivalency |
| Immigrants | Trinidad and Tobago | 0.1 /100 | #274 | Tragic 82.8% |
| Seminole | 0.1 /100 | #275 | Tragic 82.8% |
| Blacks/African Americans | 0.1 /100 | #276 | Tragic 82.8% |
| Arapaho | 0.1 /100 | #277 | Tragic 82.8% |
| Immigrants | Laos | 0.1 /100 | #278 | Tragic 82.7% |
| Immigrants | Fiji | 0.1 /100 | #279 | Tragic 82.7% |
| Cheyenne | 0.1 /100 | #280 | Tragic 82.7% |
| Sioux | 0.1 /100 | #281 | Tragic 82.6% |
| Immigrants | Immigrants | 0.1 /100 | #282 | Tragic 82.6% |
| Indonesians | 0.1 /100 | #283 | Tragic 82.5% |
| Immigrants | Barbados | 0.1 /100 | #284 | Tragic 82.4% |
| Cajuns | 0.0 /100 | #285 | Tragic 82.4% |
| Immigrants | West Indies | 0.0 /100 | #286 | Tragic 82.4% |
| Japanese | 0.0 /100 | #287 | Tragic 82.4% |
| Pueblo | 0.0 /100 | #288 | Tragic 82.3% |
Demographics Similar to Ghanaians by GED/Equivalency
In terms of ged/equivalency, the demographic groups most similar to Ghanaians are Immigrants from Eritrea (84.3%, a difference of 0.0%), Immigrants from Nigeria (84.3%, a difference of 0.020%), Subsaharan African (84.2%, a difference of 0.070%), Immigrants from South America (84.4%, a difference of 0.10%), and Immigrants from Panama (84.4%, a difference of 0.10%).
| Demographics | Rating | Rank | GED/Equivalency |
| Immigrants | Liberia | 4.9 /100 | #228 | Tragic 84.4% |
| Immigrants | Uruguay | 4.6 /100 | #229 | Tragic 84.4% |
| Immigrants | Colombia | 4.5 /100 | #230 | Tragic 84.4% |
| Immigrants | Middle Africa | 4.3 /100 | #231 | Tragic 84.4% |
| Immigrants | South America | 4.2 /100 | #232 | Tragic 84.4% |
| Immigrants | Panama | 4.1 /100 | #233 | Tragic 84.4% |
| Immigrants | Nigeria | 3.6 /100 | #234 | Tragic 84.3% |
| Ghanaians | 3.5 /100 | #235 | Tragic 84.3% |
| Immigrants | Eritrea | 3.5 /100 | #236 | Tragic 84.3% |
| Sub-Saharan Africans | 3.0 /100 | #237 | Tragic 84.2% |
| Immigrants | Peru | 2.7 /100 | #238 | Tragic 84.2% |
| Immigrants | Bahamas | 2.6 /100 | #239 | Tragic 84.2% |
| Immigrants | South Eastern Asia | 2.5 /100 | #240 | Tragic 84.1% |
| Senegalese | 1.9 /100 | #241 | Tragic 84.0% |
| Sri Lankans | 1.9 /100 | #242 | Tragic 84.0% |