Puget Sound Salish vs Ghanaian GED/Equivalency
COMPARE
Puget Sound Salish
Ghanaian
GED/Equivalency
GED/Equivalency Comparison
Puget Sound Salish
Ghanaians
85.2%
GED/EQUIVALENCY
20.8/ 100
METRIC RATING
194th/ 347
METRIC RANK
84.3%
GED/EQUIVALENCY
3.5/ 100
METRIC RATING
235th/ 347
METRIC RANK
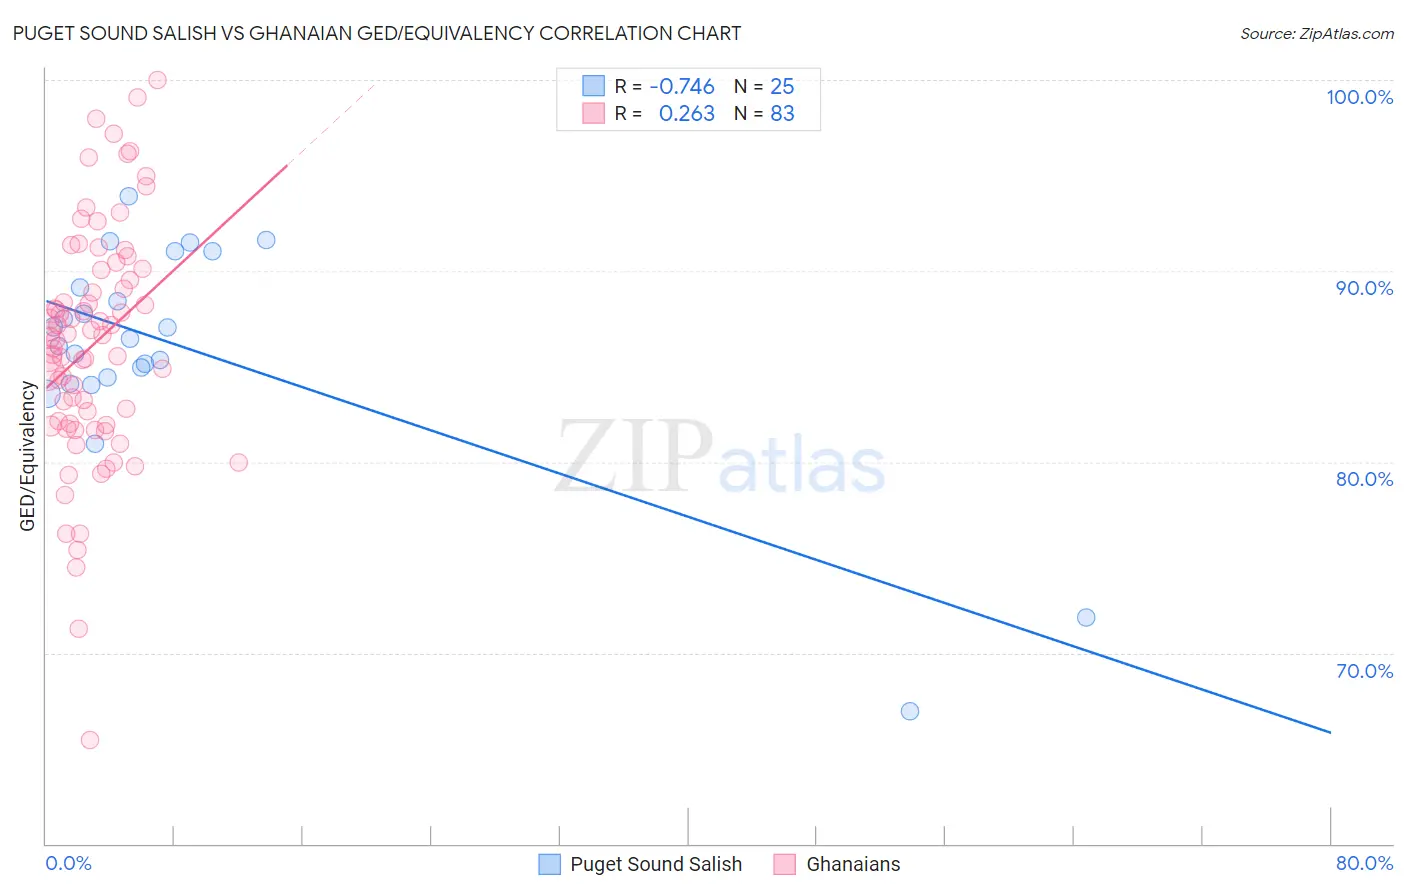
Puget Sound Salish vs Ghanaian GED/Equivalency Correlation Chart
The statistical analysis conducted on geographies consisting of 46,155,775 people shows a strong negative correlation between the proportion of Puget Sound Salish and percentage of population with at least ged/equivalency education in the United States with a correlation coefficient (R) of -0.746 and weighted average of 85.2%. Similarly, the statistical analysis conducted on geographies consisting of 190,714,079 people shows a weak positive correlation between the proportion of Ghanaians and percentage of population with at least ged/equivalency education in the United States with a correlation coefficient (R) of 0.263 and weighted average of 84.3%, a difference of 1.0%.
GED/Equivalency Correlation Summary
| Measurement | Puget Sound Salish | Ghanaian |
| Minimum | 66.9% | 65.4% |
| Maximum | 93.9% | 100.0% |
| Range | 26.9% | 34.6% |
| Mean | 85.9% | 86.1% |
| Median | 86.5% | 86.5% |
| Interquartile 25% (IQ1) | 84.3% | 81.9% |
| Interquartile 75% (IQ3) | 90.1% | 90.1% |
| Interquartile Range (IQR) | 5.8% | 8.1% |
| Standard Deviation (Sample) | 5.9% | 6.2% |
| Standard Deviation (Population) | 5.8% | 6.2% |
Similar Demographics by GED/Equivalency
Demographics Similar to Puget Sound Salish by GED/Equivalency
In terms of ged/equivalency, the demographic groups most similar to Puget Sound Salish are Chippewa (85.2%, a difference of 0.0%), Tongan (85.2%, a difference of 0.0%), Costa Rican (85.2%, a difference of 0.010%), Delaware (85.2%, a difference of 0.040%), and South American Indian (85.2%, a difference of 0.060%).
| Demographics | Rating | Rank | GED/Equivalency |
| Immigrants | Afghanistan | 29.8 /100 | #187 | Fair 85.4% |
| Immigrants | Sierra Leone | 29.0 /100 | #188 | Fair 85.4% |
| Guamanians/Chamorros | 28.4 /100 | #189 | Fair 85.3% |
| Alaskan Athabascans | 27.5 /100 | #190 | Fair 85.3% |
| South American Indians | 22.8 /100 | #191 | Fair 85.2% |
| Immigrants | Nonimmigrants | 22.7 /100 | #192 | Fair 85.2% |
| Delaware | 22.2 /100 | #193 | Fair 85.2% |
| Puget Sound Salish | 20.8 /100 | #194 | Fair 85.2% |
| Chippewa | 20.8 /100 | #195 | Fair 85.2% |
| Tongans | 20.7 /100 | #196 | Fair 85.2% |
| Costa Ricans | 20.4 /100 | #197 | Fair 85.2% |
| Immigrants | Africa | 17.5 /100 | #198 | Poor 85.1% |
| Somalis | 16.4 /100 | #199 | Poor 85.0% |
| Uruguayans | 16.0 /100 | #200 | Poor 85.0% |
| Portuguese | 15.9 /100 | #201 | Poor 85.0% |
Demographics Similar to Ghanaians by GED/Equivalency
In terms of ged/equivalency, the demographic groups most similar to Ghanaians are Immigrants from Eritrea (84.3%, a difference of 0.0%), Immigrants from Nigeria (84.3%, a difference of 0.020%), Subsaharan African (84.2%, a difference of 0.070%), Immigrants from South America (84.4%, a difference of 0.10%), and Immigrants from Panama (84.4%, a difference of 0.10%).
| Demographics | Rating | Rank | GED/Equivalency |
| Immigrants | Liberia | 4.9 /100 | #228 | Tragic 84.4% |
| Immigrants | Uruguay | 4.6 /100 | #229 | Tragic 84.4% |
| Immigrants | Colombia | 4.5 /100 | #230 | Tragic 84.4% |
| Immigrants | Middle Africa | 4.3 /100 | #231 | Tragic 84.4% |
| Immigrants | South America | 4.2 /100 | #232 | Tragic 84.4% |
| Immigrants | Panama | 4.1 /100 | #233 | Tragic 84.4% |
| Immigrants | Nigeria | 3.6 /100 | #234 | Tragic 84.3% |
| Ghanaians | 3.5 /100 | #235 | Tragic 84.3% |
| Immigrants | Eritrea | 3.5 /100 | #236 | Tragic 84.3% |
| Sub-Saharan Africans | 3.0 /100 | #237 | Tragic 84.2% |
| Immigrants | Peru | 2.7 /100 | #238 | Tragic 84.2% |
| Immigrants | Bahamas | 2.6 /100 | #239 | Tragic 84.2% |
| Immigrants | South Eastern Asia | 2.5 /100 | #240 | Tragic 84.1% |
| Senegalese | 1.9 /100 | #241 | Tragic 84.0% |
| Sri Lankans | 1.9 /100 | #242 | Tragic 84.0% |