Immigrants from Spain vs Immigrants from Cambodia GED/Equivalency
COMPARE
Immigrants from Spain
Immigrants from Cambodia
GED/Equivalency
GED/Equivalency Comparison
Immigrants from Spain
Immigrants from Cambodia
86.7%
GED/EQUIVALENCY
88.5/ 100
METRIC RATING
131st/ 347
METRIC RANK
82.2%
GED/EQUIVALENCY
0.0/ 100
METRIC RATING
289th/ 347
METRIC RANK
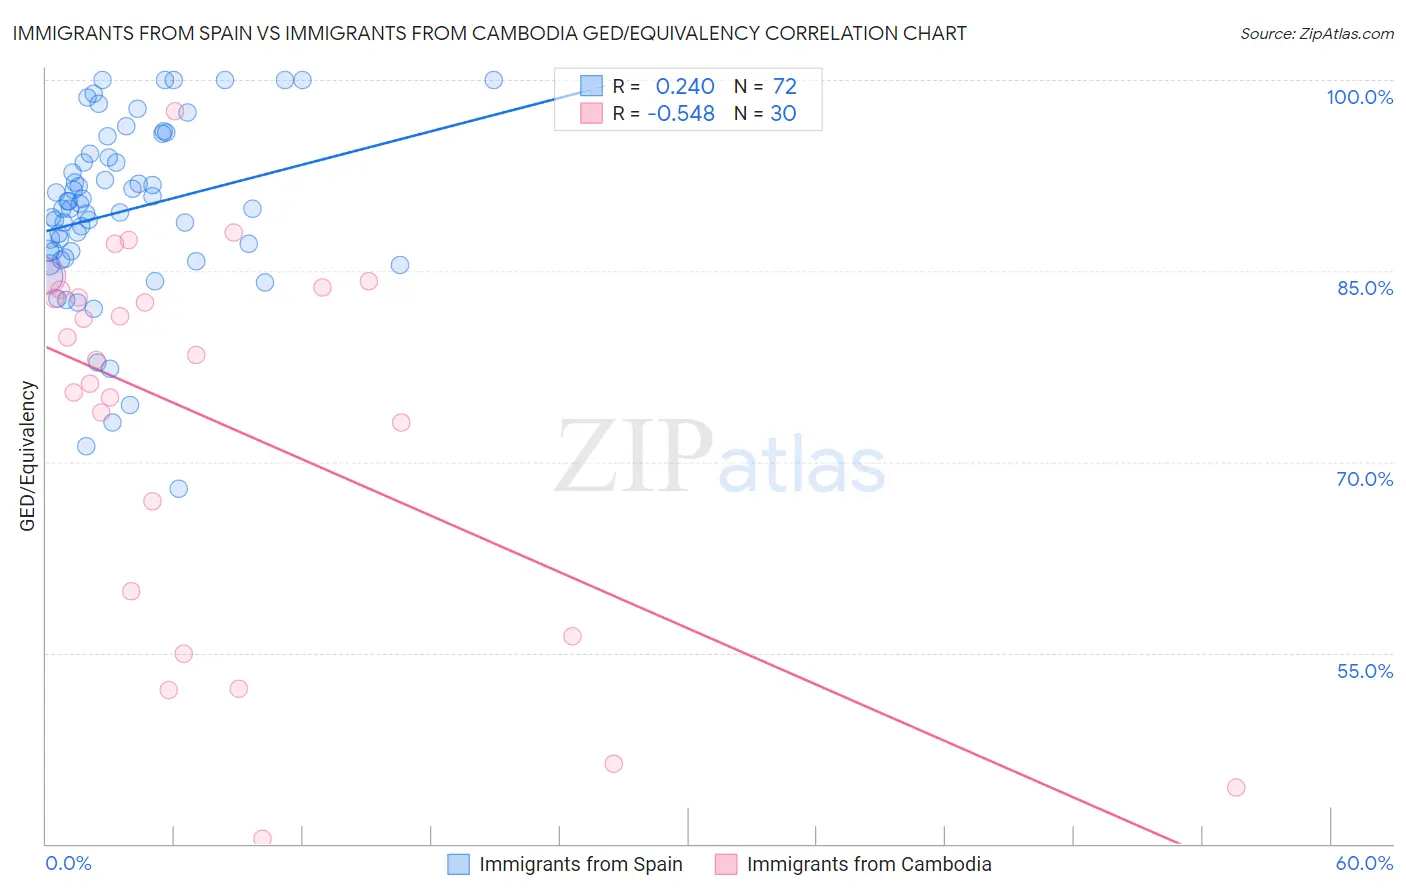
Immigrants from Spain vs Immigrants from Cambodia GED/Equivalency Correlation Chart
The statistical analysis conducted on geographies consisting of 239,682,725 people shows a weak positive correlation between the proportion of Immigrants from Spain and percentage of population with at least ged/equivalency education in the United States with a correlation coefficient (R) of 0.240 and weighted average of 86.7%. Similarly, the statistical analysis conducted on geographies consisting of 205,153,442 people shows a substantial negative correlation between the proportion of Immigrants from Cambodia and percentage of population with at least ged/equivalency education in the United States with a correlation coefficient (R) of -0.548 and weighted average of 82.2%, a difference of 5.4%.
GED/Equivalency Correlation Summary
| Measurement | Immigrants from Spain | Immigrants from Cambodia |
| Minimum | 67.9% | 40.4% |
| Maximum | 100.0% | 97.5% |
| Range | 32.1% | 57.1% |
| Mean | 89.7% | 73.0% |
| Median | 89.9% | 78.2% |
| Interquartile 25% (IQ1) | 86.3% | 59.8% |
| Interquartile 75% (IQ3) | 94.1% | 83.5% |
| Interquartile Range (IQR) | 7.8% | 23.7% |
| Standard Deviation (Sample) | 7.0% | 15.0% |
| Standard Deviation (Population) | 6.9% | 14.8% |
Similar Demographics by GED/Equivalency
Demographics Similar to Immigrants from Spain by GED/Equivalency
In terms of ged/equivalency, the demographic groups most similar to Immigrants from Spain are Immigrants from Brazil (86.6%, a difference of 0.0%), Tsimshian (86.6%, a difference of 0.010%), Immigrants from Ukraine (86.7%, a difference of 0.020%), Immigrants from Germany (86.7%, a difference of 0.020%), and Albanian (86.6%, a difference of 0.040%).
| Demographics | Rating | Rank | GED/Equivalency |
| Immigrants | Egypt | 90.4 /100 | #124 | Exceptional 86.7% |
| Celtics | 90.4 /100 | #125 | Exceptional 86.7% |
| Asians | 90.3 /100 | #126 | Exceptional 86.7% |
| Argentineans | 89.7 /100 | #127 | Excellent 86.7% |
| Yugoslavians | 89.5 /100 | #128 | Excellent 86.7% |
| Immigrants | Ukraine | 88.9 /100 | #129 | Excellent 86.7% |
| Immigrants | Germany | 88.8 /100 | #130 | Excellent 86.7% |
| Immigrants | Spain | 88.5 /100 | #131 | Excellent 86.7% |
| Immigrants | Brazil | 88.4 /100 | #132 | Excellent 86.6% |
| Tsimshian | 88.3 /100 | #133 | Excellent 86.6% |
| Albanians | 87.7 /100 | #134 | Excellent 86.6% |
| Immigrants | Asia | 87.4 /100 | #135 | Excellent 86.6% |
| Chileans | 86.9 /100 | #136 | Excellent 86.6% |
| Arabs | 86.7 /100 | #137 | Excellent 86.6% |
| Immigrants | Argentina | 86.5 /100 | #138 | Excellent 86.6% |
Demographics Similar to Immigrants from Cambodia by GED/Equivalency
In terms of ged/equivalency, the demographic groups most similar to Immigrants from Cambodia are Pueblo (82.3%, a difference of 0.080%), Japanese (82.4%, a difference of 0.18%), Immigrants from West Indies (82.4%, a difference of 0.19%), Haitian (82.1%, a difference of 0.19%), and Cajun (82.4%, a difference of 0.22%).
| Demographics | Rating | Rank | GED/Equivalency |
| Immigrants | Immigrants | 0.1 /100 | #282 | Tragic 82.6% |
| Indonesians | 0.1 /100 | #283 | Tragic 82.5% |
| Immigrants | Barbados | 0.1 /100 | #284 | Tragic 82.4% |
| Cajuns | 0.0 /100 | #285 | Tragic 82.4% |
| Immigrants | West Indies | 0.0 /100 | #286 | Tragic 82.4% |
| Japanese | 0.0 /100 | #287 | Tragic 82.4% |
| Pueblo | 0.0 /100 | #288 | Tragic 82.3% |
| Immigrants | Cambodia | 0.0 /100 | #289 | Tragic 82.2% |
| Haitians | 0.0 /100 | #290 | Tragic 82.1% |
| Cubans | 0.0 /100 | #291 | Tragic 82.0% |
| Paiute | 0.0 /100 | #292 | Tragic 82.0% |
| British West Indians | 0.0 /100 | #293 | Tragic 82.0% |
| Immigrants | St. Vincent and the Grenadines | 0.0 /100 | #294 | Tragic 82.0% |
| Nepalese | 0.0 /100 | #295 | Tragic 81.9% |
| Vietnamese | 0.0 /100 | #296 | Tragic 81.9% |