Immigrants from Spain vs Ghanaian 7th Grade
COMPARE
Immigrants from Spain
Ghanaian
7th Grade
7th Grade Comparison
Immigrants from Spain
Ghanaians
96.0%
7TH GRADE
38.8/ 100
METRIC RATING
183rd/ 347
METRIC RANK
95.3%
7TH GRADE
0.7/ 100
METRIC RATING
258th/ 347
METRIC RANK
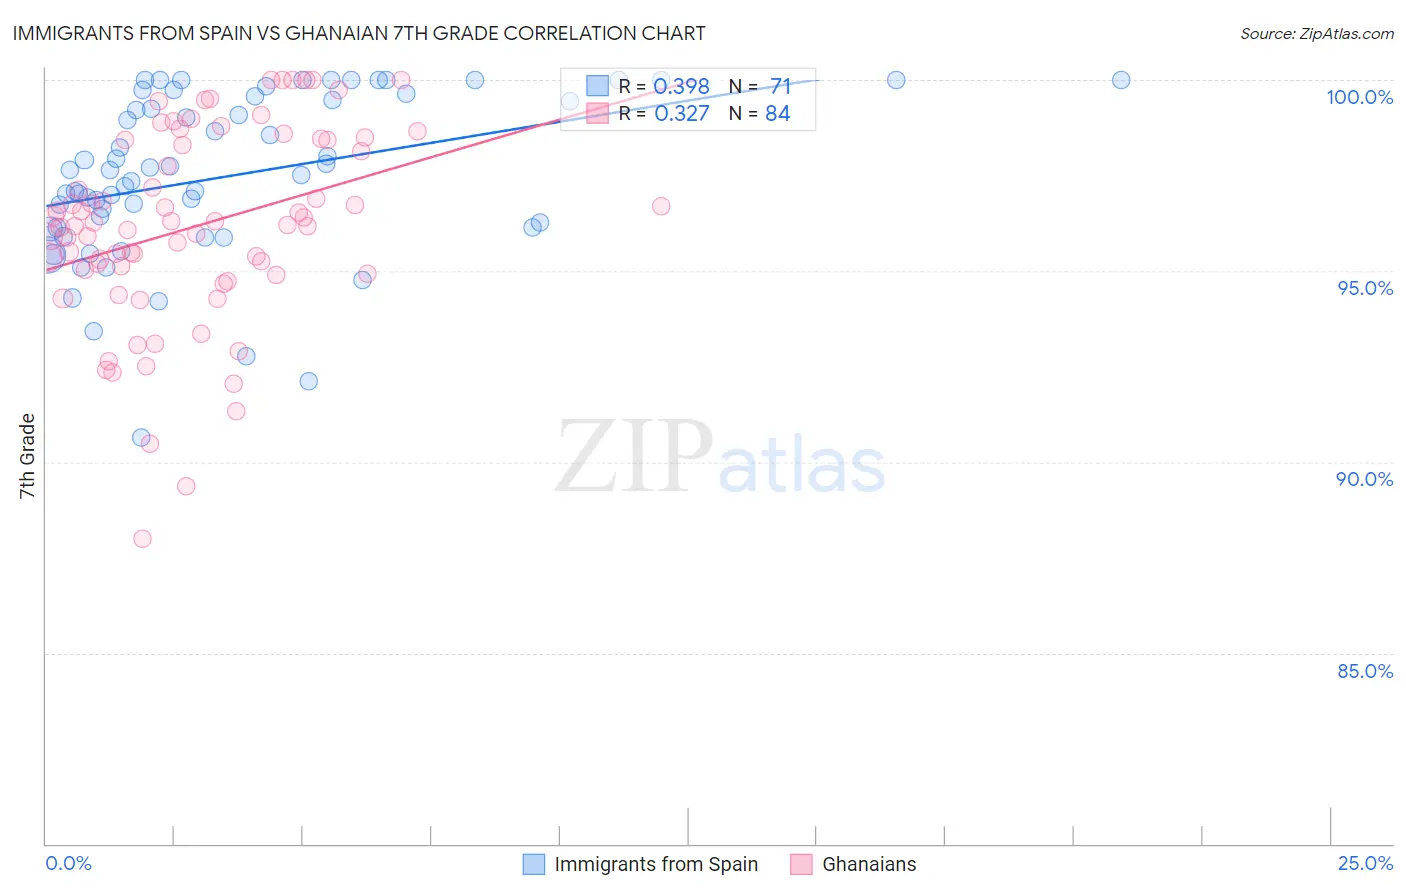
Immigrants from Spain vs Ghanaian 7th Grade Correlation Chart
The statistical analysis conducted on geographies consisting of 239,679,924 people shows a mild positive correlation between the proportion of Immigrants from Spain and percentage of population with at least 7th grade education in the United States with a correlation coefficient (R) of 0.398 and weighted average of 96.0%. Similarly, the statistical analysis conducted on geographies consisting of 190,712,873 people shows a mild positive correlation between the proportion of Ghanaians and percentage of population with at least 7th grade education in the United States with a correlation coefficient (R) of 0.327 and weighted average of 95.3%, a difference of 0.69%.
7th Grade Correlation Summary
| Measurement | Immigrants from Spain | Ghanaian |
| Minimum | 90.6% | 88.0% |
| Maximum | 100.0% | 100.0% |
| Range | 9.4% | 12.0% |
| Mean | 97.5% | 96.2% |
| Median | 97.6% | 96.2% |
| Interquartile 25% (IQ1) | 96.1% | 95.0% |
| Interquartile 75% (IQ3) | 99.6% | 98.4% |
| Interquartile Range (IQR) | 3.4% | 3.4% |
| Standard Deviation (Sample) | 2.1% | 2.5% |
| Standard Deviation (Population) | 2.1% | 2.5% |
Similar Demographics by 7th Grade
Demographics Similar to Immigrants from Spain by 7th Grade
In terms of 7th grade, the demographic groups most similar to Immigrants from Spain are Sierra Leonean (96.0%, a difference of 0.010%), Brazilian (96.0%, a difference of 0.010%), Iraqi (96.0%, a difference of 0.020%), Immigrants from Iraq (96.0%, a difference of 0.020%), and Immigrants from Uganda (96.0%, a difference of 0.020%).
| Demographics | Rating | Rank | 7th Grade |
| Chileans | 49.3 /100 | #176 | Average 96.0% |
| Immigrants | Korea | 49.2 /100 | #177 | Average 96.0% |
| Marshallese | 48.4 /100 | #178 | Average 96.0% |
| Immigrants | Iran | 47.8 /100 | #179 | Average 96.0% |
| Immigrants | Brazil | 46.8 /100 | #180 | Average 96.0% |
| Pakistanis | 44.5 /100 | #181 | Average 96.0% |
| Iraqis | 41.2 /100 | #182 | Average 96.0% |
| Immigrants | Spain | 38.8 /100 | #183 | Fair 96.0% |
| Sierra Leoneans | 37.5 /100 | #184 | Fair 96.0% |
| Brazilians | 37.3 /100 | #185 | Fair 96.0% |
| Immigrants | Iraq | 36.1 /100 | #186 | Fair 96.0% |
| Immigrants | Uganda | 36.0 /100 | #187 | Fair 96.0% |
| Immigrants | Egypt | 34.3 /100 | #188 | Fair 95.9% |
| Immigrants | Venezuela | 33.9 /100 | #189 | Fair 95.9% |
| Immigrants | Micronesia | 32.6 /100 | #190 | Fair 95.9% |
Demographics Similar to Ghanaians by 7th Grade
In terms of 7th grade, the demographic groups most similar to Ghanaians are Immigrants from China (95.3%, a difference of 0.0%), Immigrants from Congo (95.3%, a difference of 0.0%), Korean (95.3%, a difference of 0.010%), Colombian (95.3%, a difference of 0.020%), and Somali (95.3%, a difference of 0.030%).
| Demographics | Rating | Rank | 7th Grade |
| Immigrants | Jamaica | 0.9 /100 | #251 | Tragic 95.4% |
| Immigrants | Ethiopia | 0.9 /100 | #252 | Tragic 95.3% |
| Somalis | 0.9 /100 | #253 | Tragic 95.3% |
| Colombians | 0.8 /100 | #254 | Tragic 95.3% |
| Koreans | 0.8 /100 | #255 | Tragic 95.3% |
| Immigrants | China | 0.7 /100 | #256 | Tragic 95.3% |
| Immigrants | Congo | 0.7 /100 | #257 | Tragic 95.3% |
| Ghanaians | 0.7 /100 | #258 | Tragic 95.3% |
| Immigrants | Costa Rica | 0.6 /100 | #259 | Tragic 95.3% |
| Afghans | 0.5 /100 | #260 | Tragic 95.3% |
| South Americans | 0.5 /100 | #261 | Tragic 95.2% |
| Immigrants | Somalia | 0.5 /100 | #262 | Tragic 95.2% |
| West Indians | 0.5 /100 | #263 | Tragic 95.2% |
| Immigrants | Nigeria | 0.4 /100 | #264 | Tragic 95.2% |
| Immigrants | Uruguay | 0.3 /100 | #265 | Tragic 95.2% |