Immigrants from Italy vs African GED/Equivalency
COMPARE
Immigrants from Italy
African
GED/Equivalency
GED/Equivalency Comparison
Immigrants from Italy
Africans
86.7%
GED/EQUIVALENCY
90.5/ 100
METRIC RATING
123rd/ 347
METRIC RANK
83.4%
GED/EQUIVALENCY
0.5/ 100
METRIC RATING
256th/ 347
METRIC RANK
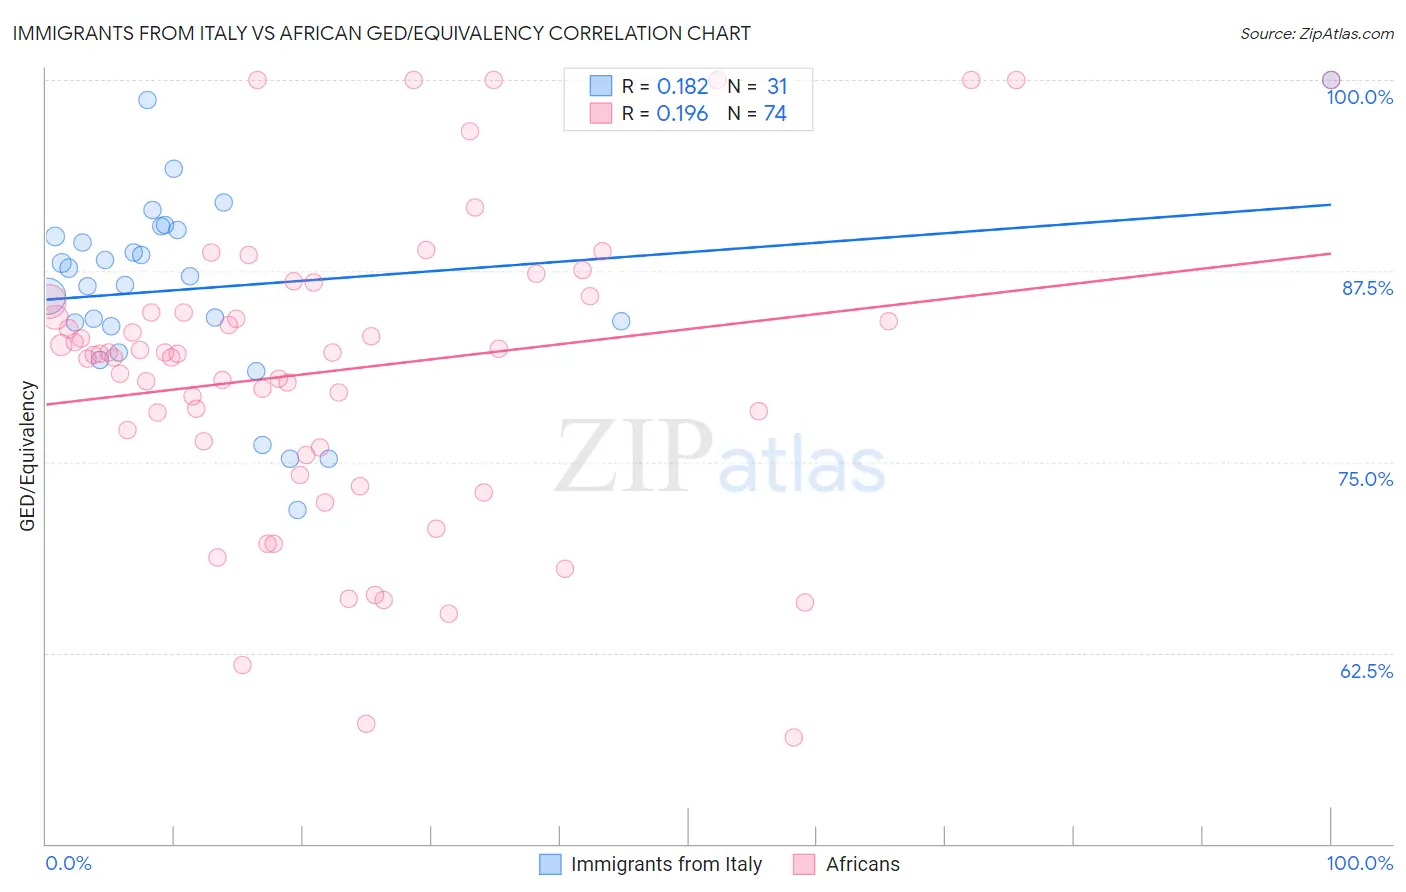
Immigrants from Italy vs African GED/Equivalency Correlation Chart
The statistical analysis conducted on geographies consisting of 324,225,968 people shows a poor positive correlation between the proportion of Immigrants from Italy and percentage of population with at least ged/equivalency education in the United States with a correlation coefficient (R) of 0.182 and weighted average of 86.7%. Similarly, the statistical analysis conducted on geographies consisting of 470,092,963 people shows a poor positive correlation between the proportion of Africans and percentage of population with at least ged/equivalency education in the United States with a correlation coefficient (R) of 0.196 and weighted average of 83.4%, a difference of 4.0%.
GED/Equivalency Correlation Summary
| Measurement | Immigrants from Italy | African |
| Minimum | 71.8% | 56.9% |
| Maximum | 100.0% | 100.0% |
| Range | 28.2% | 43.1% |
| Mean | 86.4% | 81.0% |
| Median | 87.2% | 82.1% |
| Interquartile 25% (IQ1) | 83.9% | 75.9% |
| Interquartile 75% (IQ3) | 90.2% | 85.5% |
| Interquartile Range (IQR) | 6.3% | 9.6% |
| Standard Deviation (Sample) | 6.3% | 9.9% |
| Standard Deviation (Population) | 6.2% | 9.8% |
Similar Demographics by GED/Equivalency
Demographics Similar to Immigrants from Italy by GED/Equivalency
In terms of ged/equivalency, the demographic groups most similar to Immigrants from Italy are Immigrants from Egypt (86.7%, a difference of 0.010%), Celtic (86.7%, a difference of 0.010%), Immigrants from Lebanon (86.8%, a difference of 0.020%), Immigrants from Jordan (86.8%, a difference of 0.020%), and Asian (86.7%, a difference of 0.020%).
| Demographics | Rating | Rank | GED/Equivalency |
| Swiss | 94.5 /100 | #116 | Exceptional 87.0% |
| Immigrants | Hong Kong | 93.8 /100 | #117 | Exceptional 86.9% |
| French Canadians | 93.2 /100 | #118 | Exceptional 86.9% |
| Immigrants | China | 93.2 /100 | #119 | Exceptional 86.9% |
| Scotch-Irish | 91.6 /100 | #120 | Exceptional 86.8% |
| Immigrants | Lebanon | 90.9 /100 | #121 | Exceptional 86.8% |
| Immigrants | Jordan | 90.8 /100 | #122 | Exceptional 86.8% |
| Immigrants | Italy | 90.5 /100 | #123 | Exceptional 86.7% |
| Immigrants | Egypt | 90.4 /100 | #124 | Exceptional 86.7% |
| Celtics | 90.4 /100 | #125 | Exceptional 86.7% |
| Asians | 90.3 /100 | #126 | Exceptional 86.7% |
| Argentineans | 89.7 /100 | #127 | Excellent 86.7% |
| Yugoslavians | 89.5 /100 | #128 | Excellent 86.7% |
| Immigrants | Ukraine | 88.9 /100 | #129 | Excellent 86.7% |
| Immigrants | Germany | 88.8 /100 | #130 | Excellent 86.7% |
Demographics Similar to Africans by GED/Equivalency
In terms of ged/equivalency, the demographic groups most similar to Africans are Colville (83.4%, a difference of 0.010%), Jamaican (83.3%, a difference of 0.13%), Malaysian (83.3%, a difference of 0.16%), Creek (83.6%, a difference of 0.18%), and Comanche (83.6%, a difference of 0.20%).
| Demographics | Rating | Rank | GED/Equivalency |
| Crow | 1.1 /100 | #249 | Tragic 83.8% |
| Shoshone | 1.0 /100 | #250 | Tragic 83.7% |
| Spanish Americans | 0.8 /100 | #251 | Tragic 83.6% |
| Bahamians | 0.8 /100 | #252 | Tragic 83.6% |
| Comanche | 0.7 /100 | #253 | Tragic 83.6% |
| Creek | 0.7 /100 | #254 | Tragic 83.6% |
| Colville | 0.5 /100 | #255 | Tragic 83.4% |
| Africans | 0.5 /100 | #256 | Tragic 83.4% |
| Jamaicans | 0.4 /100 | #257 | Tragic 83.3% |
| Malaysians | 0.4 /100 | #258 | Tragic 83.3% |
| Immigrants | Vietnam | 0.3 /100 | #259 | Tragic 83.2% |
| Choctaw | 0.3 /100 | #260 | Tragic 83.1% |
| Inupiat | 0.2 /100 | #261 | Tragic 83.1% |
| Immigrants | Armenia | 0.2 /100 | #262 | Tragic 83.1% |
| Immigrants | Congo | 0.2 /100 | #263 | Tragic 83.1% |